
The Late Cycle Lament: The Dual Economy, Minsky Moments, and Other Concerns
Thanks to a subscriber for this report from GMO by James Montier which may be of interest. Here is a section:

Here is a link to full report and here is a section from it:
Having highlighted these ominous portents, let us return to the main buyer of U.S. equities, USA Inc. This group has been engaged in a massive debt for equity swap – issuing enormous amounts of debt and buying back its own shares or purchasing other companies. Now it may be perfectly rational for each individual company to engage in this pursuit, issuing bonds at low interest rates and buying back their own equity. Of course, this raises leverage. And in aggregate it may create a fallacy of composition. What is good for each individual company is not necessarily good for every company as a whole.
Rising leverage creates a systemic fragility. It appears that everyone has forgotten about Minsky once more. Minsky was the creator of the financial instability hypothesis. Simply put, this states that stability begets instability. The quieter and safer the world appears, the more one is tempted to take on “risk” because extrapolation says there is no risk, and hence a free lunch exists. By taking on this risk, people sow the seeds of their own destruction. All the leverage makes the system more vulnerable, more fragile, and ensures that the outcome will be significantly worse than would otherwise have been the case.
Exhibit 17 shows two ways of measuring the leverage of USA Inc. My preferred measure is the ratio of debt to gross value added (GVA), as this is akin to debt to EBITDA. It shows that we are once again approaching the levels of debt we saw in 2007. The other measure is debt to net worth, a frequently cited though, in my humble opinion, a pretty useless indicator. The problem with this measure is the denominator. If we had been looking at this measure in 2007 we would have concluded that we were well past the peak of vulnerability. It was only after markets collapsed that this measure rose (as net worth obviously fell).
The listed sector is particularly vulnerable in this cycle as it has seen far faster growth in debt than the total of USA Inc. According to the Fed, corporate debt has been growing at around 4% p.a. since 2007. However, in the listed sector it has been growing at approximately 10% p.a. The stock of listed sector debt now stands at 20% of GDP, far above the level reached in 2007 (see Exhibit 18). This should obviously be of concern for equity holders as well as debt holders, because debt is a senior claim in the capital structure to equity.
We aren’t the only ones to voice concerns in this realm. The Bank of International Settlements (BIS) (the central bankers’ central bank) has also noted similar concerns (see Exhibit 19). It has shown the number of “Zombie” firms (defined as firms aged at least 10 years old with an EBIT to net interest expense below 1) has soared. BIS also notes the general drift down in corporate debt ratings over time. Indeed, today over half of the total stock of U.S. corporate debt is to be found in the lowest possible rating for investment grade bonds.
When half of all corporate debt is rated at BBB, one big step above junk, that raises big questions about financing costs and source of the funds necessary to continue to buy back prodigious quantities of shares.
On a weighted average cost of capital basis debt is a cheaper source of financing than equity but what never seems to be discussed is that is a false economy. The greatest merit of equities is dividends can be cancelled during time of stress. Coupons on the other hand have to be paid. With the quantity of debt rising that is gong to represent a continuous draw on cashflow for years to come which is not an issue right now because earnings are still rising. However, in the event earnings do not continue to trend higher that represents a challenge for the buyback tailwind markets have enjoyed for all of this bull market.
I created the following charts of the supply of stock on various stock market indices to highlight the fact the USA has enjoyed a significant tailwind from buybacks and that has contributed to the outperformance of Wall Street.
The supply of stock on the NYSE Composite has been trending lower since 2002.
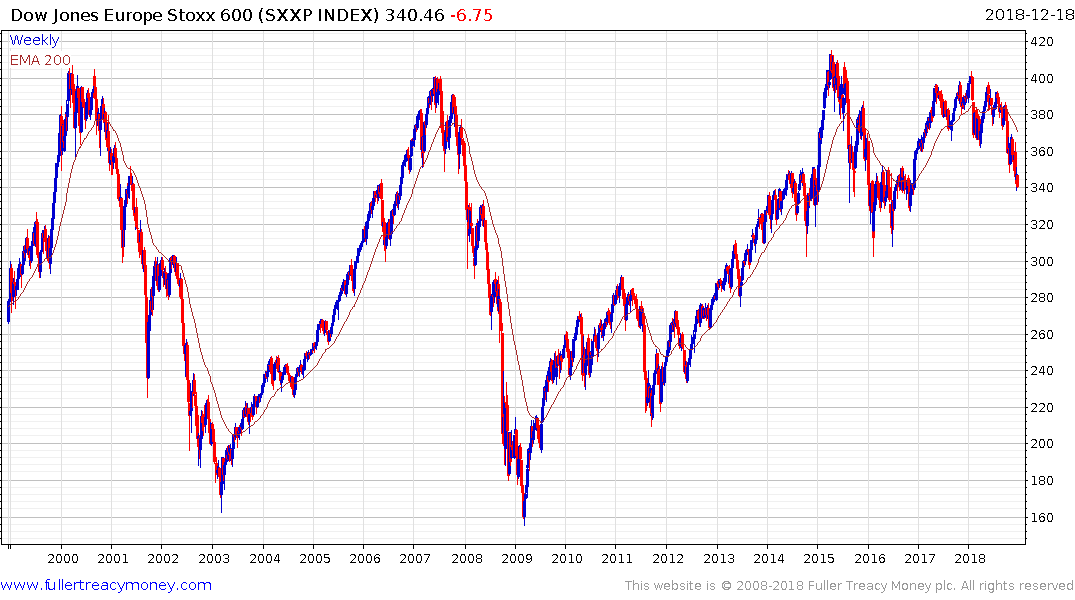
The supply of stock for the Europe STOXX 600 has been trending higher over the same timeframe.
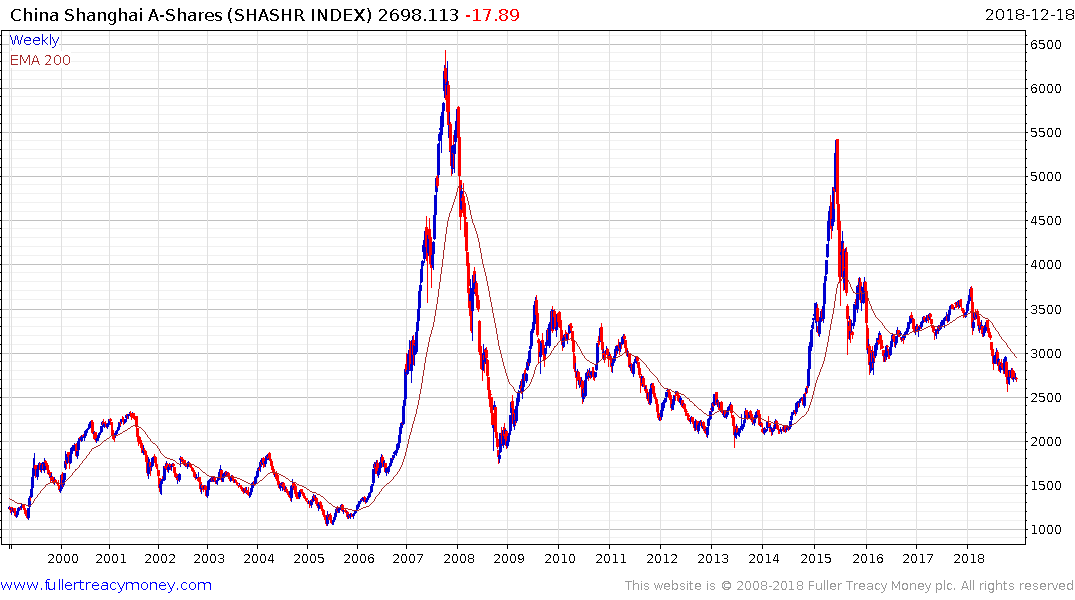
The supply stock on the Shanghai A-Share Index has been trending higher for a decade.
What these charts tell us is that supply is not the only arbiter of performance but it is significant buyer at the margin. If the trend of US supply of stock starts to trend higher that is going to represent a headwind to continued upside.
That is why the announcement of Uber, Lyft and Slack’s IPOs caught my attention which are coming hot on the heels of Meituan Dianping’s in Hong Kong. These obese unicorns coming to market at just the same time that liquidity is drying up represent a significant source of new supply hitting the market. The fact that this is classic late cycle activity will not be lost on subscribers.