
The Changing Investment Climate: Higher Correlation Risks as QE Benefits Fade
Thanks to a subscriber for this note from Morgan Stanley which may be of interest. Here is a section:
The long-term effects of these purchases have, over time, whittled down the fundamental component of an asset’s valuation, leaving what is left over, the risk premia, to become more prominent. The unintended consequences are higher volatility, increased correlations, and decreased value of risky assets. This, in turn, ends up reducing the value of risky assets—an attenuation of QE policy that produces the opposite effects of its original design. We refer to this change in the investment climate as QE policy attenuation, a new dynamic risk factor that investors need to account for in their allocations by adding strategies that reduce correlation risks in order to balance their portfolios.
In addition to QE policy attenuation, additional structural risk factors have arisen from financial market regulation that has reduced liquidity and adversely impacted an economic transfer of risk. This promotes a rise in idiosyncratic uncertainties that increases volatility, or risk for fixed income asset returns, which creates anxiety for investors who expect bonds to be a more stable investment. We find that all these structural risk factors compound and manifest in the risk premia component of an asset’s valuation. Risk premia, once a small part of an asset’s overall valuation, thus now has a larger influence on asset price changes. This presents a challenge to investors as changes in risk premia are highly unpredictable, difficult to calculate and tend to have the characteristic of highly correlating asset prices.

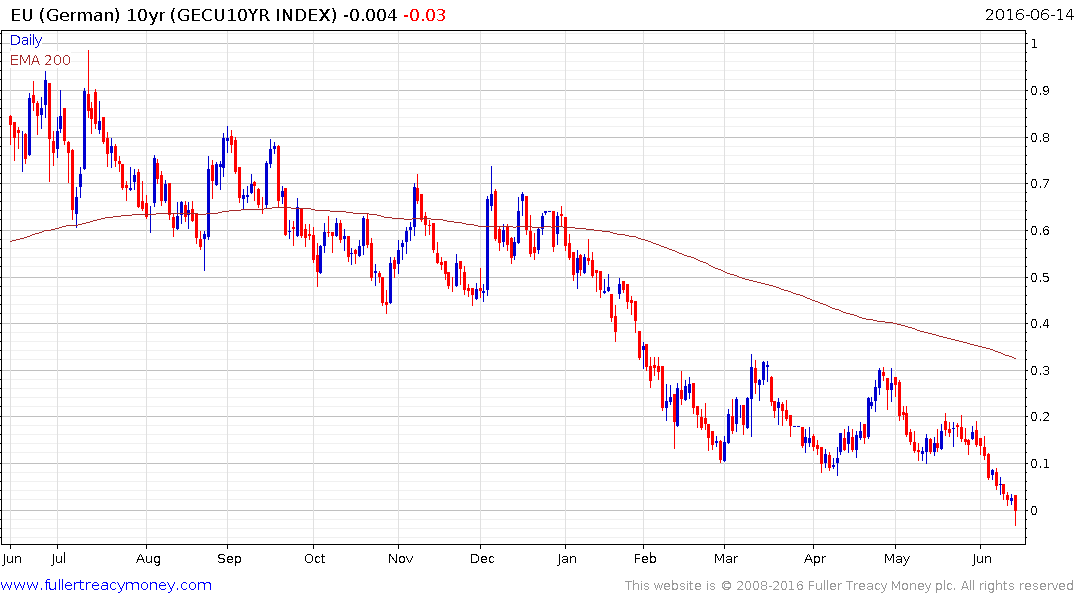
With greater than $10 Trillion in debt now with a negative yield it is a bit of an understatement to say that extraordinary monetary policy has had a distorting effect on bonds markets. Nevertheless, as with any momentum move that exhibits acceleration the market will look like the strongest asset in the world until it turns.
This log scale chart highlights just how much of a distortion negative rates exert on Bund yields and this is but one example since Bunds only went negative this week. The acceleration is clearly evident on the log chart because the scale is exaggerated by negative numbers but the effect is compressed by the arithmetic scale so the true picture is probably somewhere in between.
This P&F chart has been falling since August 2015 so when a three box reversal occurs it is likely to signal a major change in the near-term outlook for the market. Considering the level at which the market is right now it could represent medium or even long-term turn.
.png)
This link to a presentation by Howard Marks at Google may also be of interest.