
Summary Edition Credit Suisse Global Investment Returns Yearbook 2019
Thanks to a subscriber for this report which may be of interest. Here is a section:

Here is a link to the full report and here is a section from it:
For those trying to judge what “normal service” should look like, the authors continue to stress that investors should assume a more sober view of the likely excess returns equities can generate from here. This is not just judged against the standards of the last decade, but also by comparison with the 4% observed across the life of the Yearbook. A more tempered view is a natural consequence of what by historical standards remains a world of low real interest rates. To this point, in documenting the long-run history of real interest rates in 23 countries since 1900, the study shows that, when real rates are low, future returns on equities and bonds tend to be lower rather than higher.
The Yearbook does highlight that shifts from one real interest rate environment to another can see step changes in returns as investors reset their future expectations. Should a turn in the monetary cycle see an upward reset in real interest rates, the reset in financial assets can be in the opposite direction. While the immediate concerns on interest rates may have abated in this early part of 2019, this is still a scenario to keep foremost in mind. The Credit Suisse House View does not suggest a tightening cycle in the USA is complete nor has it begun in Continental Europe. The working premise that the authors still believe investors should factor into their long-term thinking and modelling is an annualized equity premium relative to cash of around 3½%. This is a consistent view they have held throughout this millennium and has more or less proven to be the case. If this is disappointing based on recent history, it still points to equities historically doubling relative to cash over 20 years.
The long-run average of returns is indeed somewhere between 3.5% and 4%. However, despite the neat mathematics of the 119-year history we know from experience that manias occur and are inevitably followed by bear markets where valuations correct.
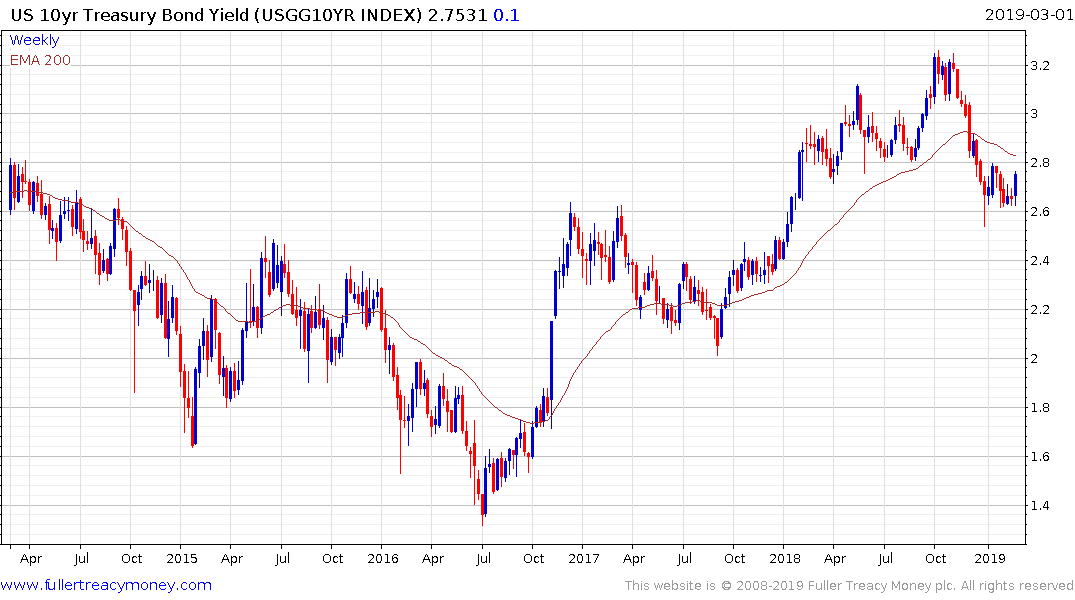
US 10-year Treasury yields move in long-term cycles and the compression in yields has been underway for 39 years. A point I have made previously is that timeframe coincides the length of a Kondratieff Wave.
This article by Shelley Hagan for Bloomberg highlights the fact that it is quite possible wage growth is underestimated. Meanwhile, Shadow Stats has been highlighting for years how much official statistics understate inflation.
10-year yields are below the trend mean but above the psychological 2.5% level. This narrow range is not going to persist indefinitely and this week's upward dynamic suggests a further expansion is more likely than not. When we get a clear breakout that is sustained during an econiomic contraction we will have evidence of whether the bond secular bears are finally correct.
Back to top