
Stock market technical review

David Fuller's view Global
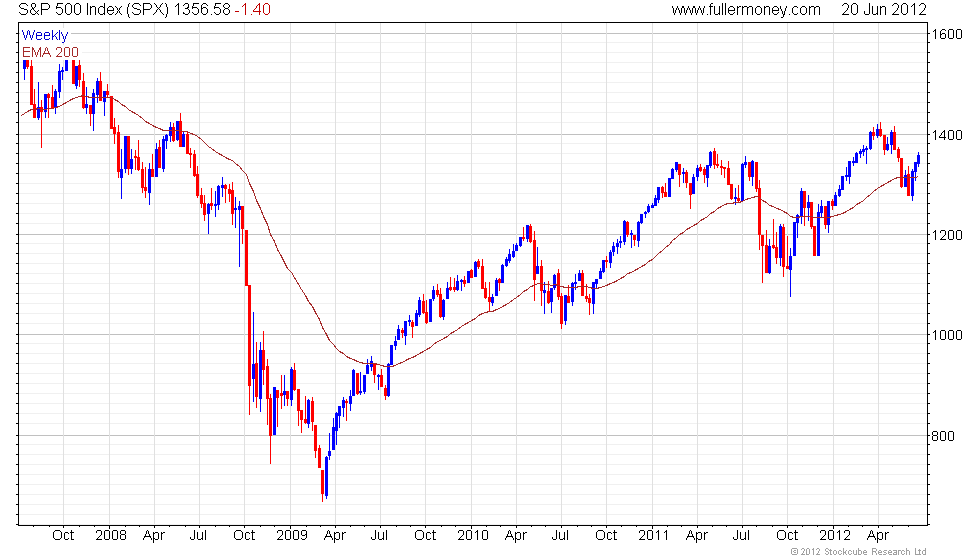
stock market indices experienced a sell-off in May and early June. This created
oversold conditions and became somewhat climactic, as we discussed at the time.
The subsequent technical rally following
a low for the S&P 500 Index on 4th June has at least partially corrected
the oversold condition and pushed short-term indicators to overbought levels.
You can see this from stochastic
indicators in the customisable 'Charting' section of the Fullermoney Library.
Using
the 'Tracking On' function when in the Library, and a weekly
chart of the S&P, you will see that a small sell-off also occurred in
May 2011, although this carried well into June before last year's high was retested
a month later. It held and the subsequent decline in August was considerably
larger. Moreover the S&P did not bottom until early October. Back then,
and also recently, Greece was a major cause of concern.
The question
that we are pondering at Fullermoney, and which will have also occurred to many
other strategists and investors, is: Could this be déjà vu all
over again, or might we have seen more than a short-term low this month?
What
makes this analysis challenging is the volatility that we have seen, relative
to the 2003-2007 bull phase. You can see the difference on this 10-year
chart of the S&P. Nevertheless and returning to the current cycle since
March 2009, you can see that the major reaction lows are still rising, as are
the highs. In the short term, the S&P has rallied up to a level where it
encounters potential resistance from the trading range evident above 1360.
Plenty
of people are bearish, which remains a contrary indicator, and some are predicting
a bear market. OK, any view is in with a chance but that cannot happen without
a sustained break of the early-June low near 1265. This is unlikely to occur
without a catalyst and what makes this a difficult call is that we do not have
to look far for candidates. For instance, I do not think it will be Greece,
at least not now, but a bigger problem could be Spain's need for a bailout and
the risk of contagion spreading to Italy and beyond. Hopefully, the proposed
launch of the European Stability Mechanism (ESM) will mitigate this risk, but
we will have to wait and see because there is little precedent.
Meanwhile,
how do some other stock markets around the world look technically?
Starting
with relative strength, South Africa (weekly
& daily) bounced from its 200-day
MA and is the first stock market to reach a new high following last month's
shakeout. It may consolidate above 34,000 but a break of the recent reaction
low near 32,730 would be required to reverse current scope for higher levels
over the medium term.
ASEAN
leader Malaysia (weekly & daily)
also bounced from the MA and is testing its highs near 1600. It broke upwards
last July and then promptly flopped. The valuations are better today but the
early-June low is now extremely important, as it is for most other stock market
indices. The Philippines (weekly &
daily), Indonesia (weekly
& daily) and Thailand (weekly
& daily) continue to show global
relative strength although JCI has a broadening pattern so the recent low is
particularly important. With what is primarily a financial sector economy, Singapore
(weekly & daily)
has lagged and needs a new high for the year to confirm fully support from the
2011 trough.
China
(weekly & daily)
is having its Godot moment; needs to maintain this year's progression of higher
reaction lows and a sustained push above 2600 remains necessary to confirm recovery
prospects.
No market
rivals Japan (weekly & daily)
in terms of 'Waiting for Godot' but it has bounced from the range lows and a
close beneath 8420 would be required to delay significantly scope for sideways
to somewhat higher trading. A firmer USD/JPY (weekly
& daily) rate, which appears possible,
should aid Japan's eventual stock market recovery.
Australia's
ASX200 (weekly & daily)
steadied at the bottom the current range, which is also near the upside breakout
point from the 2009 base. A close beneath 3980 would be required to delay current
scope for sideways to higher ranging within this lengthy base formation extension.
For the
UK (weekly & daily)
this month's higher reaction low causes the overall ranging pattern to look
less top heavy but supply evident above current levels may impede further upward
progress for a while longer.
Within
Euroland the STOXX Bank Index (weekly
& daily) has steadied this month,
following a small key day reversal at the low. Higher ranging is required to
prevent this Index from remaining a headwind for Europe's broader indices. Germany
(weekly & daily),
following a climactic decline which carried just below 6000, has seen its best
rally since the March high, suggesting that a support building process is now
underway. A close beneath the early June low near 5925 would be necessary to
offset current scope for sideways to somewhat higher ranging.
Conclusion
- Watch for a consolidation of recent gains but thereafter continue to give
a ranging recovery the benefit of the doubt provided this month's lows continue
to hold.