
Stanley Druckenmiller at The Lost Tree Club
Thanks to a subscriber for this transcript of a speech given by Stanley Druckenmiller in January. Here are some thought provoking sections:
In 2006 and 2007, which I think most of us would agree was not a down period in terms of speculation, corporations issued $700 billion in debt over that two-year period. In 2013 and 2014 they’ve already issued $1.1 trillion in debt, 50 percent more than they did in the ’06, ’07 period over the same time period. But more disturbing to me if you look at the debt that is being issued, Kenny,, back in ’06, ’07, 28 percent of that debt was B rated. Today 71 percent of the debt that’s being issued in the last two years is B rated. So, not only have we issued a lot more debt, we’re doing so at much less standards.
Another way to look at that is if those in the audience who know what covenant-light loans are, which is loans without a lot of stuff tied around you, back in ’06, ’07 less than 20 percent of the debt was issued cov-light. Now that number is over 60%. So, that’s one sign. The other sign I would say is in corporate behavior, just behavior itself. So let’s look at the current earnings of corporate America. Last year they earned $1.1 trillion, 1.4 trillion in depreciation. Now that’s about $2.5 trillion in operating cash flow. They spent 1.7 trillion on business and capital equipment and another 700 billion on dividends. So, virtually all of their operating cash flow has gone on business spending and dividends which is Okay. I’m onboard with that.
?But then they increase their debt 600 billion. How did that happen if they didn’t have negative cash flow? Because they went out and bought $567 billion worth of stock back with debt, by issuing debt. So, what’s happening is their book value is staying virtually the same, but their debt is going like this. From 1987 Greenspan took over for Volcker, our economy went from 150 percent debt to GDP to 390 percent as we have these east money policies moving people more and more out the risk curve. Interestingly, in the financial crisis that went down from about 390 to 365. But now because of corporate behavior, government behavior, and everything else, these ratios are starting to go back up.
And
I’m not net short equities. I mean the stock market right now as a percentage of GDP is higher than – with the exception of nine months from ’99 to – it’s the highest it’s been in the last hundred years or any other period except for those nine months. But you know what, when you look art the monetary policy we’re running, it should be – it should be about where it is. This is crazy stuff we’re doing. So I would say you have to be on alert to this ending badly. Is it for sure going to end badly? Not necessarily. I don’t quite know how we get out of this, but is possible.

Here is a link to the full transcript.
The considerations in the above pieces occupied a good portion of the discussion on the 2nd day of the Sinapore Chart Seminar. Major bull markets need a story to animate investor interest and liquidity to act as fuel. Considering just how profligate central banks have been, and remain, it is reasonable to characterise the trend evident since 2009 as liquidity fueled. We might have concerns about the path of central bank policy but we can only deal with the reality provided by the market.
This chart of the combined balance sheets of the Fed, ECB, PBoC, BoJ and BoE redenominated to Dollars remains in an uptrend and is breaking out as a result of the ECB’s newfound appetite for easing.
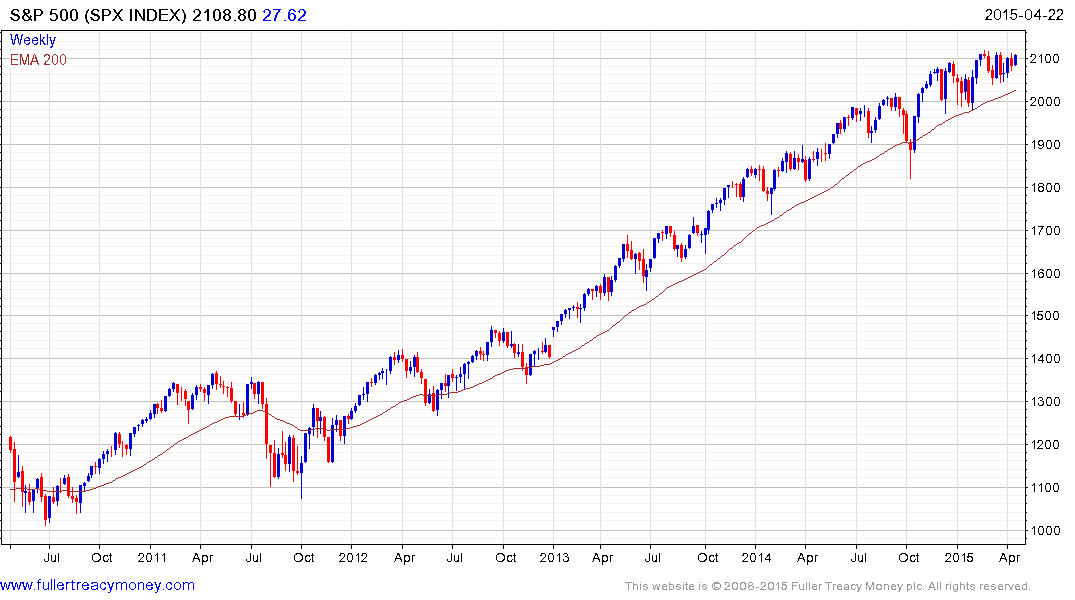
Considering the fact that capital is global and mobile, the consistency of the trends evident on major indices is a reasonable by-product of such largesse.
If one were looking for potential future warning signs of trouble I have long highlighted credit and buybacks as potential candidates.
BB corporate yields have first step above the base characteristics. It might be some time before a breakout occurs, but the higher these yields go the more expensive it will be to roll over debt and the greater difficulty companies will have in sustaining buyback programs. BB spreads appear to also look like they are poised to move higher.
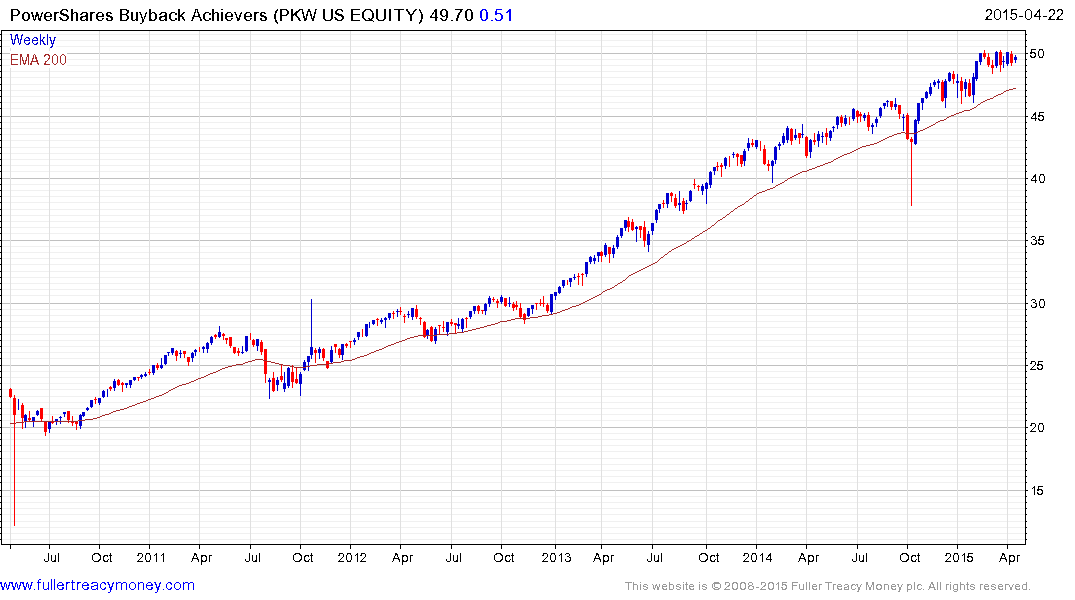
The Powershares Buyback Achievers ETF still has a similar pattern to the S&P500 not least because so many of the broad index’s constituents now have aggressive buyback programs. However the derivative instrument experienced a much sharper pullback in October, in what turned out to be a brief squall for investors. To my mind this highlights the risk of such instruments in times of market stress.
Back to top