
S&P 500 and its primary sector ETFs

The market is at an interesting juncture. The S&P is up less than 2% this year and been largely rangebound since late last year. A somewhat lengthier range after a particularly consistent advance suggests supply and demand have come back into equilibrium. Among the arguments propounded by the cautious camp are that valuations, not least the CAPE have increased and earnings have deteriorated. There is fear that the Greek issue will spill over into a bigger problem and that the Fed may raise interest rates in September.
.png)
Among the more optimistic arguments are that banks are outperforming, technological innovation is delivering new products which have the potential to improve productivity and energy prices are less of a headwind. Global central banks are also flooding the market with liquidity but the Fed has stopped adding new money.
There has been a high correlation between the performance of the S&P500 and the size of the Fed’s balance sheet since the credit crisis. It is therefore hardly a coincidence that with the end of QE, the broad stock market has had a more difficult time holding new highs. There has been a lot of commentary that the Treasury markets are illiquid but let's not forget that the Fed hold's upwards of three trillion in Treasuries and agency/mortgage debt on its balance sheet.
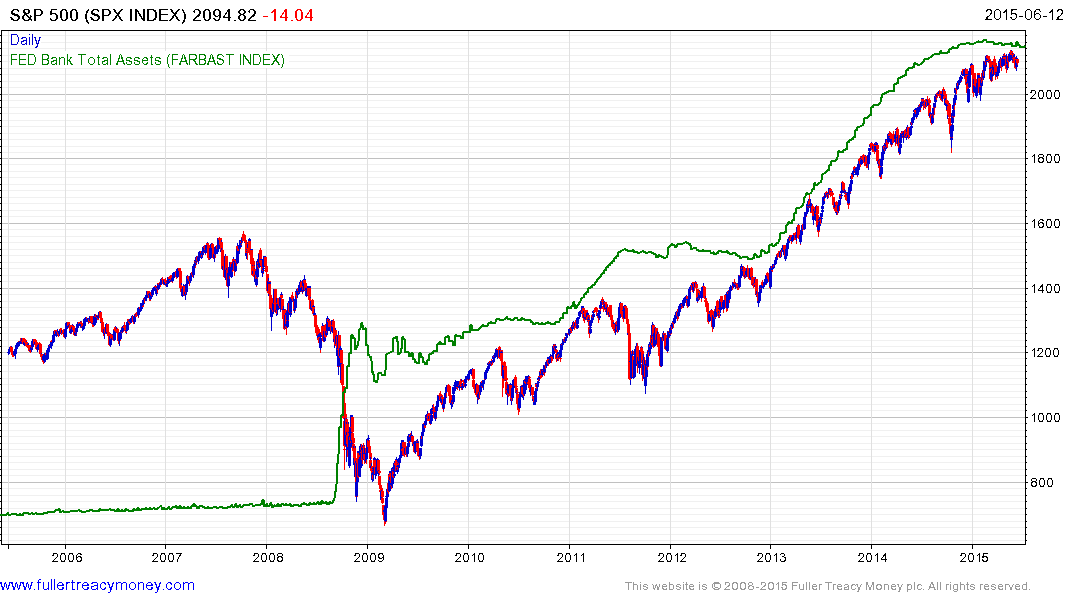
From a chart perspective, the most consistent thing about the S&P500’s charts is the fact that is has found support in the region of the 200-day MA on successive occasions for more than three-years. A buy-the-dips strategy continues to work and until it stops working the bulls will not have experienced profit erosion and will be under very little pressure to liquidate positions.
The liquidity driven funding mechanism that has allowed leveraged traders to borrow for nothing and invest is under threat. The financial engineering represented by record corporate bond issuance to fund buybacks is predicated on access to cheap credit. What happens in the bond market matters to the wider stock market so it really is worth monitoring.
Let’s review the Index’s major sectors:
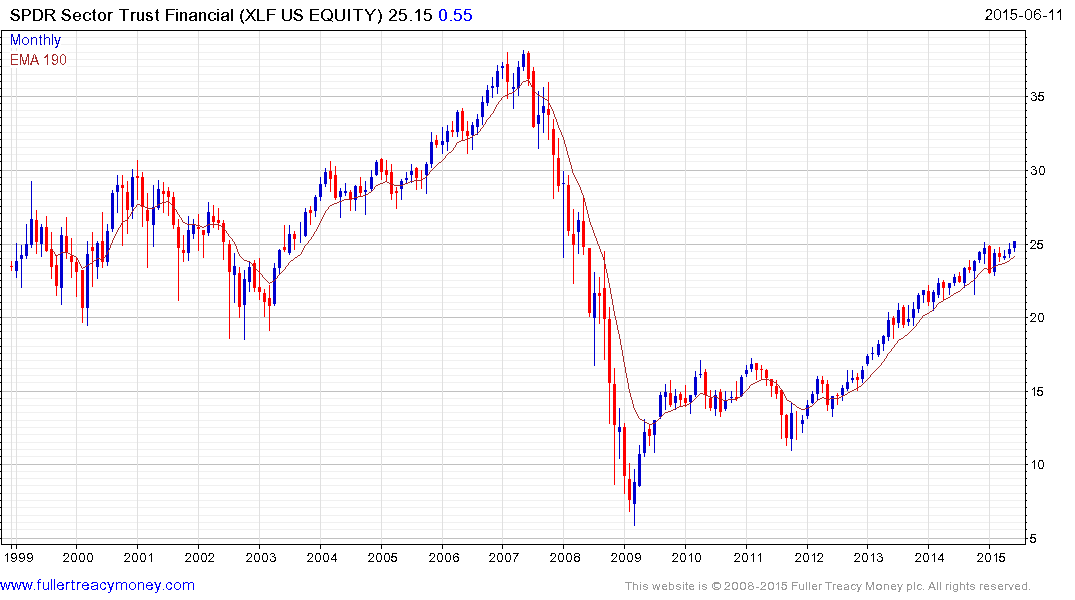
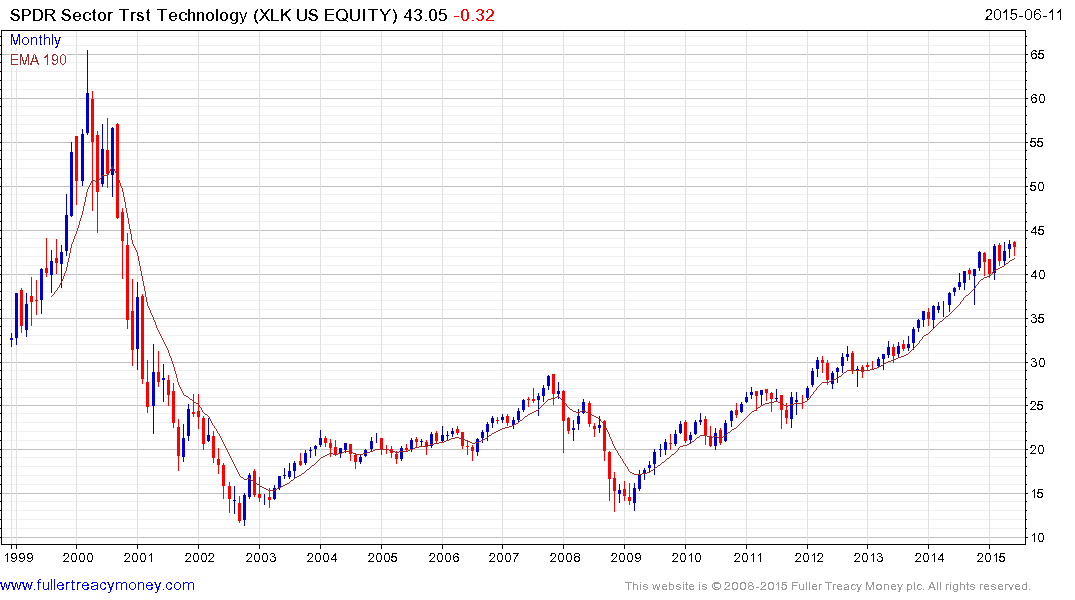
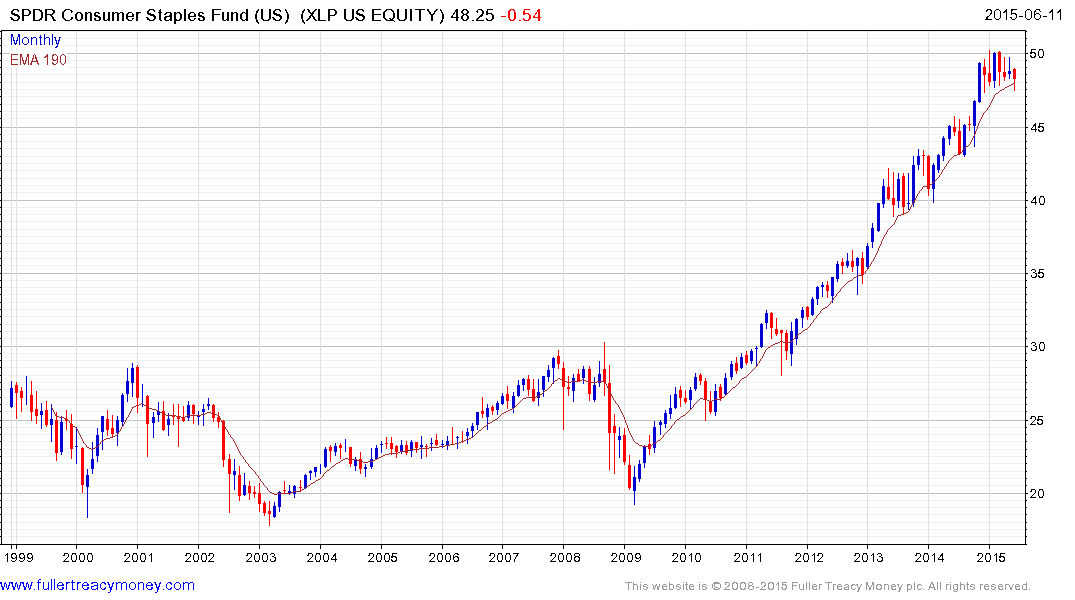
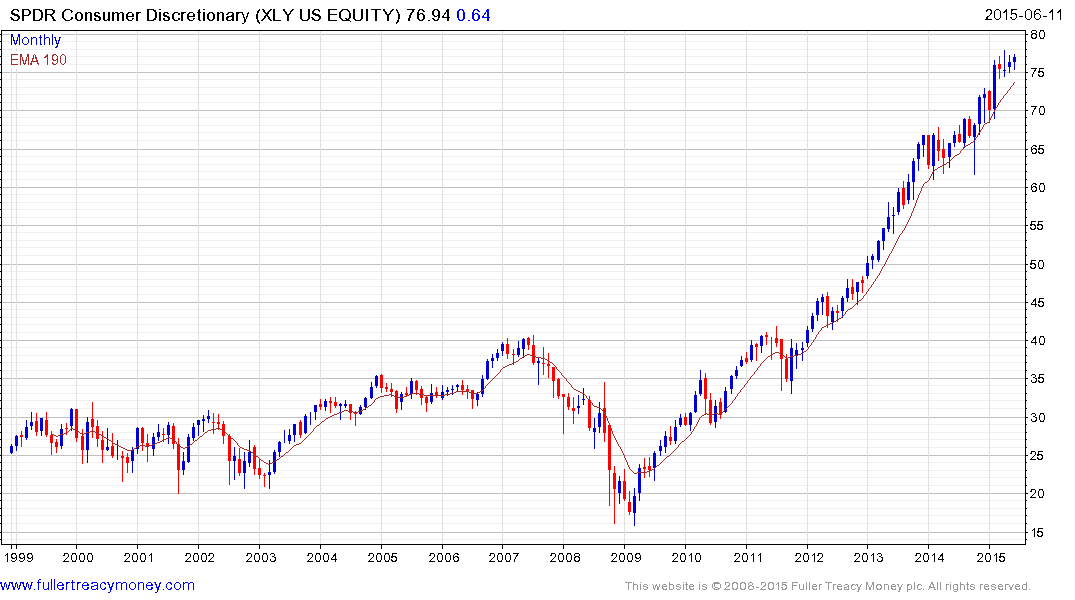
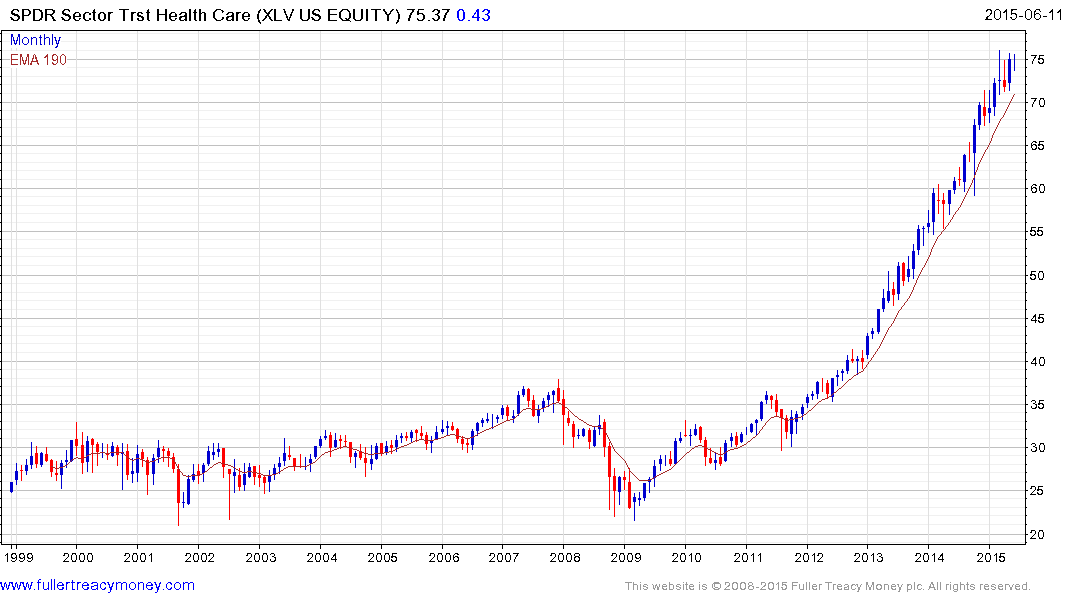
The Financial (XLF), Technology (XLK), Consumer Staples (XLP), Consumer Discretionary (XLY) and Healthcare (XLV) sectors continue to have the most consistent uptrends defined by progressions of higher reaction lows.
The SPDR Utilities ETF (XLU) has fallen below its 200-day MA and is challenging the six-year uptrend. If it is going to find support, this is the area it needs to happen in if the medium-term uptrend is to continue to be given the benefit of the doubt.
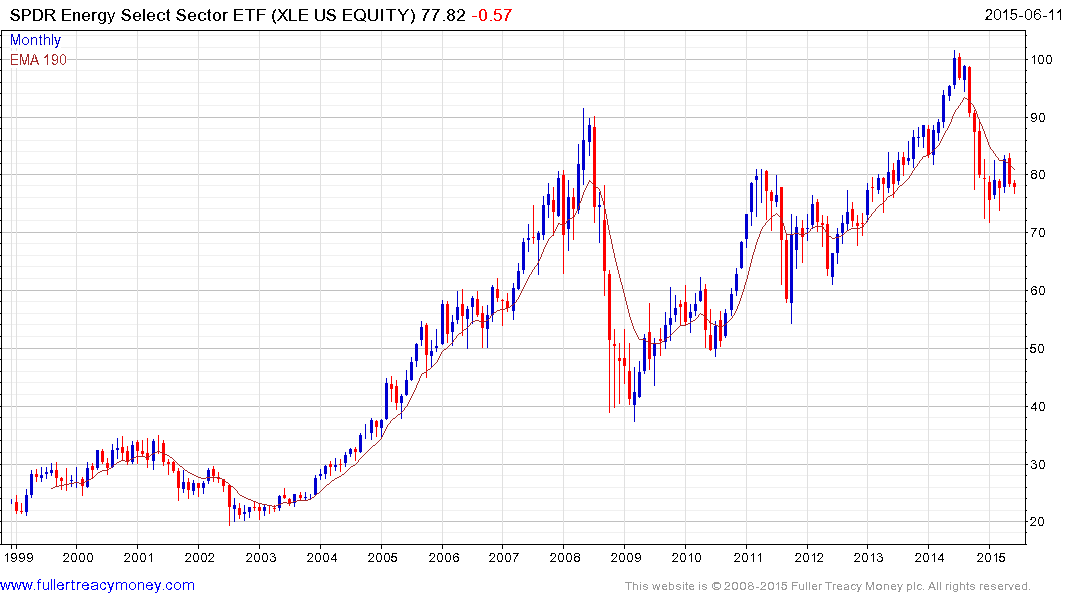
The SPDR Energy ETF (XLE) has steadied following its steep decline in the last quarter of 2014 but needs to sustain a move above $82.50 to confirm a return to demand dominance beyond the short term.
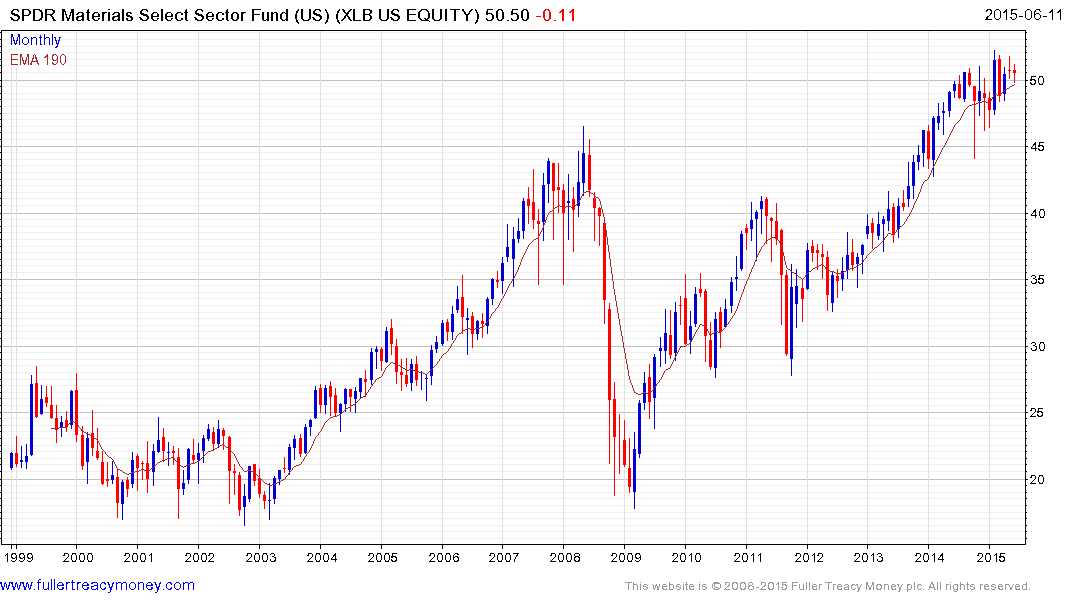
The SPDR Materials ETF (XLB), which is comprised more of chemical, compressed gasses and paper companies than miners, has lost momentum somewhat while the SPDR Industrials ETF (XLI) continues to hold the region of the 200-day MA.
In aggregate, the majority of the main sectors are still trending higher in a reasonably consistent manner. The most inconsistent thing on the charts is the sharp pullback experienced in October. At the time we hypothesised that this may be a loss consistency at the penultimate high. If the uptrend is to continue to be given the benefit of the doubt, the progression of higher reaction lows and the region of the 200-day MA need to hold.