
Russell Napier: Debt Deflation Worries Are Starting to Rise Again
Thanks to a subscriber for this article from Financial Sense which may be of interest to subscribers. Here is a section on the Velocity of Money:
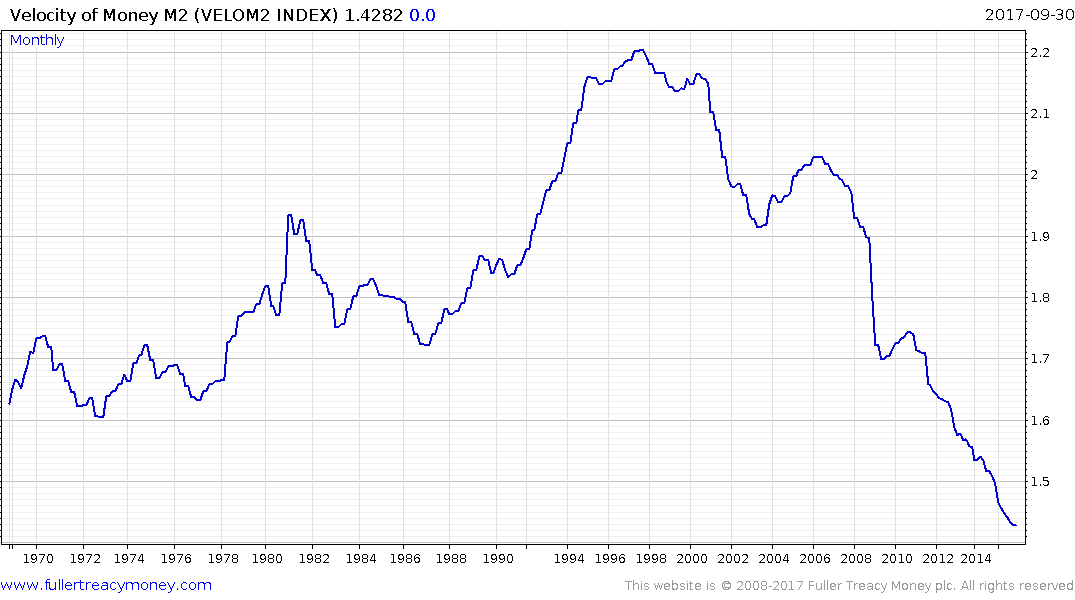
Though there is an overall tendency for velocity of money to fall over time, Napier noted, the accelerated decline we’ve seen in recent years is due to the nature of the money that is being created. This money primarily takes the form of bank reserves, which are not inherently fungible and are now stuck in the banking system.
Banks have chosen not to increase the size of their balance sheets and create deposits, which is the money that circulates in the actual economy, as opposed to the asset economy. This is why Napier thinks the velocity of money has fallen.
“There’s a form of money there that is stuck in the ‘asset ghetto,’ if you like, and not yet spreading out to normal GDP,” he said.This plays in part into the assumption most people make that the world is awash in money. While there is a lot of money in the asset markets, the reality is that M2 growth in the United States is 5 percent, which is one of the lowest levels recorded in the past 30 years, Napier noted. Apart from the 2008 to 2009 crisis, we’re back to very low levels of total money creation.
This is true of other countries, as well. China is close to a new record low in the growth of its money supply. India is also showing levels of growth in its money supply not seen since 1963.

The Velocity of M2 is at a record low based on the last update of September 30th. If Russell Napier’s contention the Index has plumbed new depths since 2010 because of stranded reserves at banks then the reduction of the Fed’s balance sheet could have a positive effect by pushing responsibility for credit creation onto the banking sector.
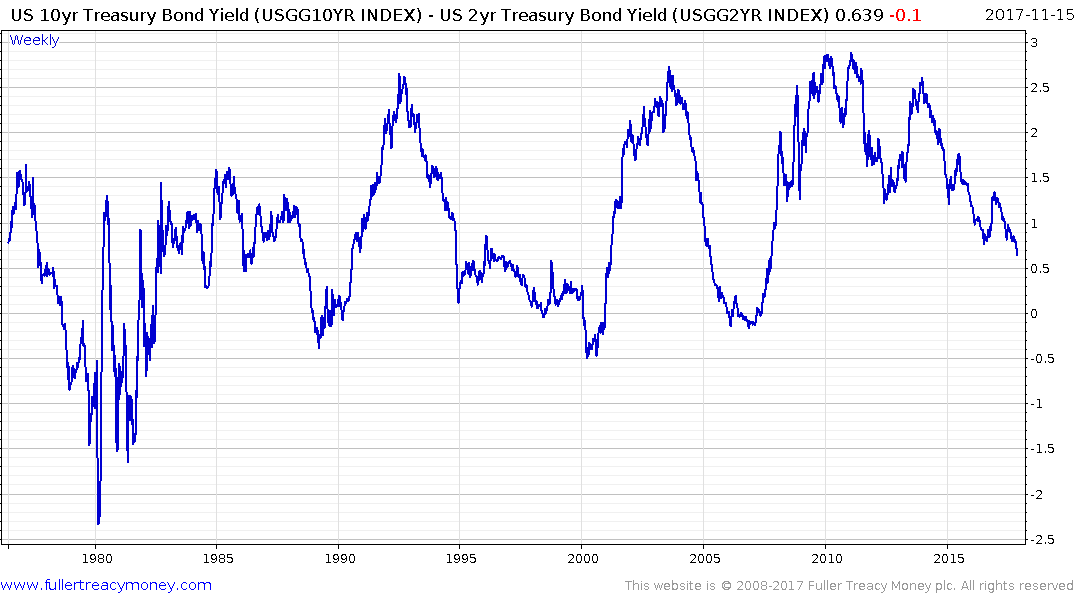
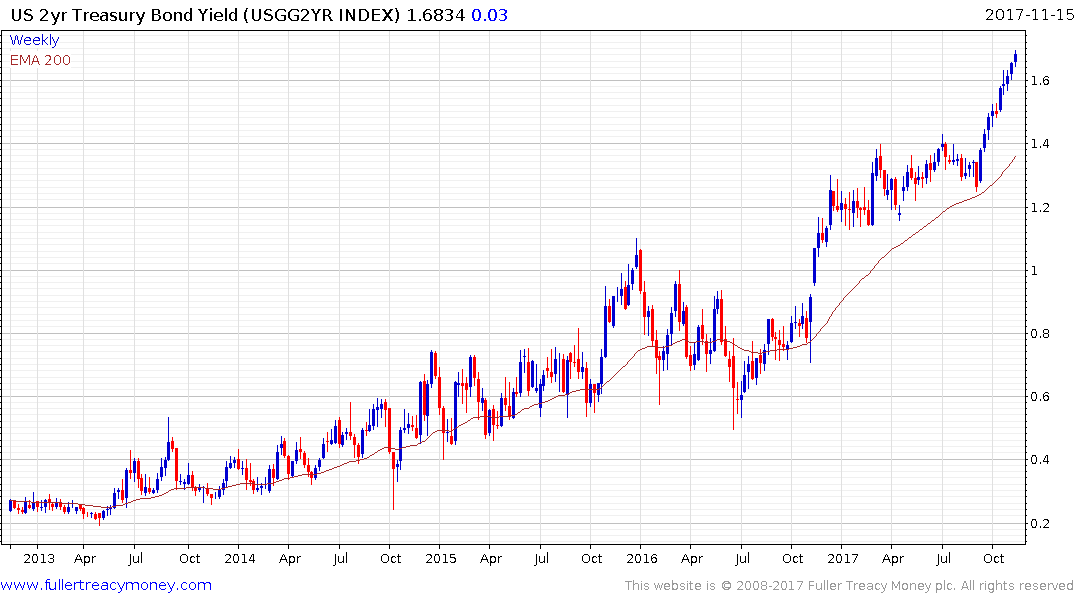
Meanwhile the yield curve spread continues to contract with two-year yields continuing to push higher. An inverted yield curve has been a reliable lead indicator for recessions over the past forty years, often with a lead of anything from 6 to 18 months. Therefore this is an important chart to monitor because the trajectory is pointing towards further contraction.
Back to top