
Recession Watch Spreads as Global Curves Follow Treasuries Trend
This article from Bloomberg may be of interest to subscribers. Here is a section:
Bond investors in New Zealand are not as sanguine. Yields on two-year debt are just two basis points below 10-year rates, the narrowest gap since 2015 when the curve last inverted. The difference between Australia’s 10- and three-year bond futures stands around 17 basis points.
Much of the fears in Australia and New Zealand are centered on concerns about the housing market, which experienced a post-pandemic boom when borrowers piled in to take advantage of record-low interest rates. The two central banks have indicated that borrowing costs will continue to rise.
“The Australian economy is already showing some cracks -- weak consumer sentiment, falling dwelling prices, cooling consumer spending -- and New Zealand’s economy is showing more,” said Andrew Ticehurst, a rates strategist at Nomura Holdings Inc. in Sydney. “Australia will slide into recession in the second quarter of next year under the weight of recent and prospective RBA rate hikes, which will expose Australia’s Achilles’ heel, an extended housing market and highly leveraged consumers.”
Australian consumer confidence dropped for a ninth straight month in August to reach a two-year low, according to a report released Tuesday by Westpac Banking Corp.

The yield curve spread (10-year – 2-year) is a reliable lead indicator for US recessions. It does not have nearly the same strong record of predicting recessions for other countries. That is probably because other countries do not rely so heavily on their banks for credit creation.
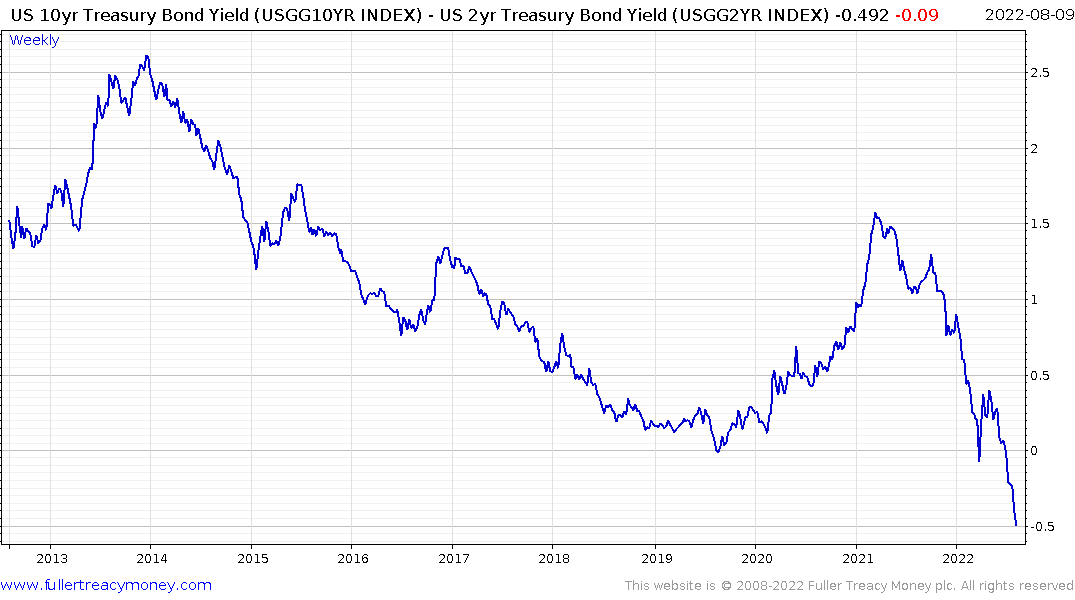
Nevertheless, high debt levels against a background of rising interest rates is a recipe for leveraged short-term borrowers and floating rate mortgage holders to get into trouble. That’s more than enough stress to fuel recessions.
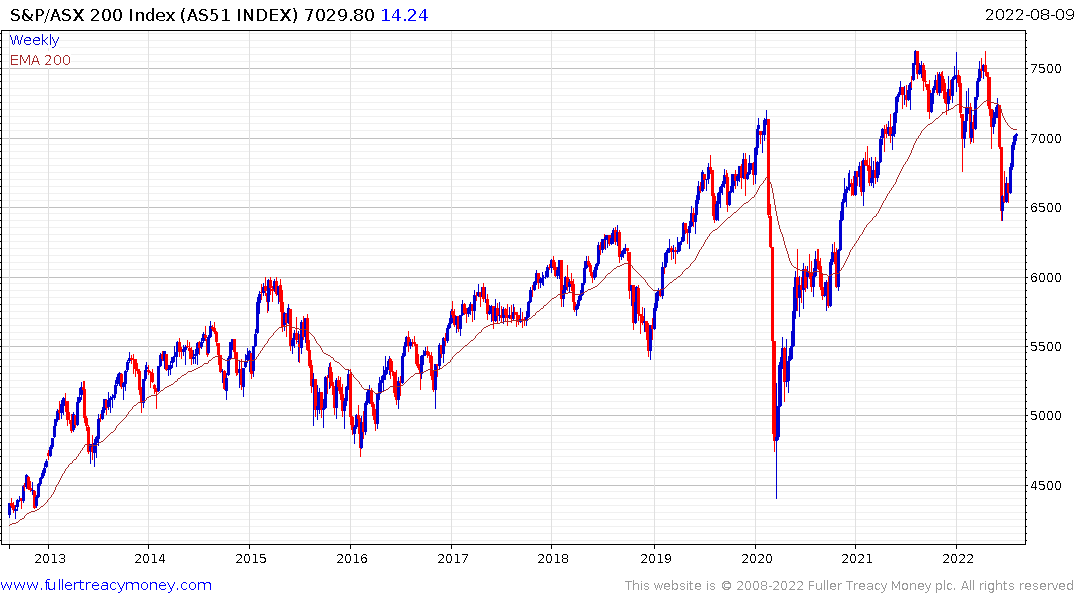
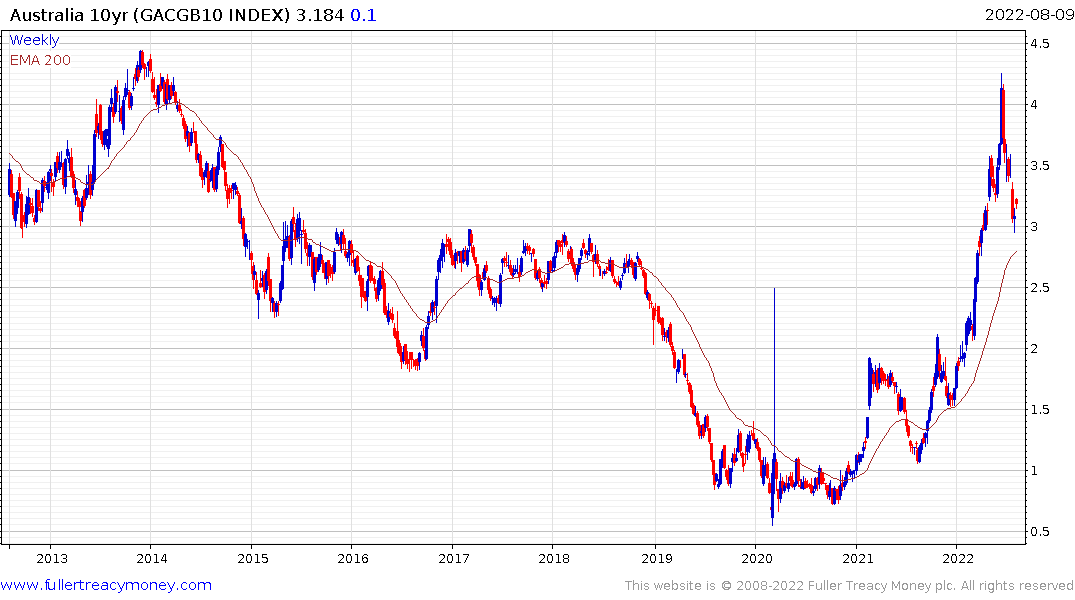
Australia’s S&P/ASX 200 is at the first area of potential resistance represented by the 200-day MA. Meanwhile bond yields are testing support in the region of the 200-day MA.
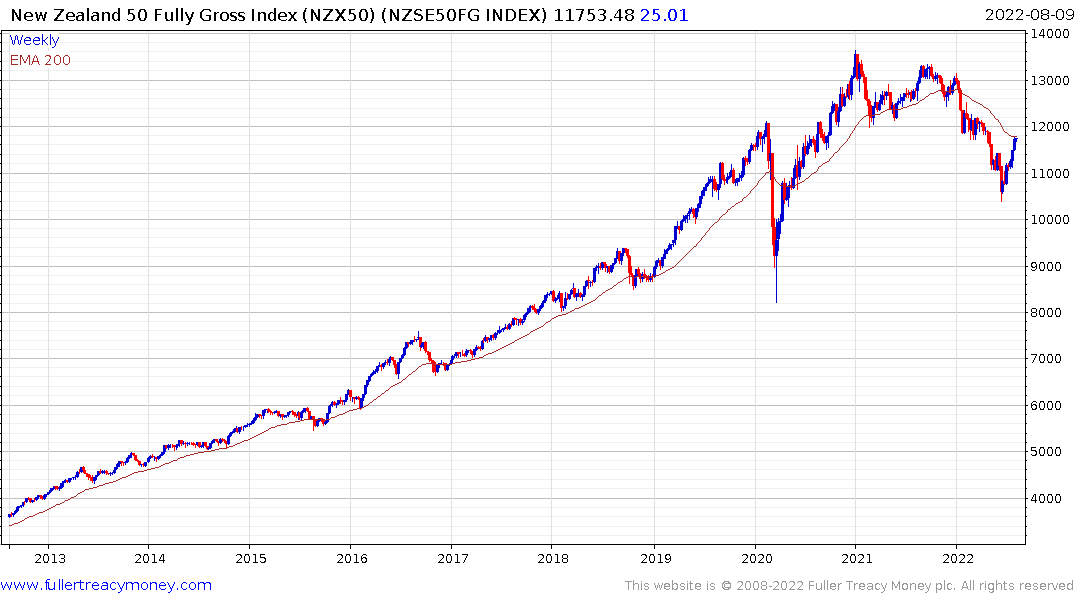
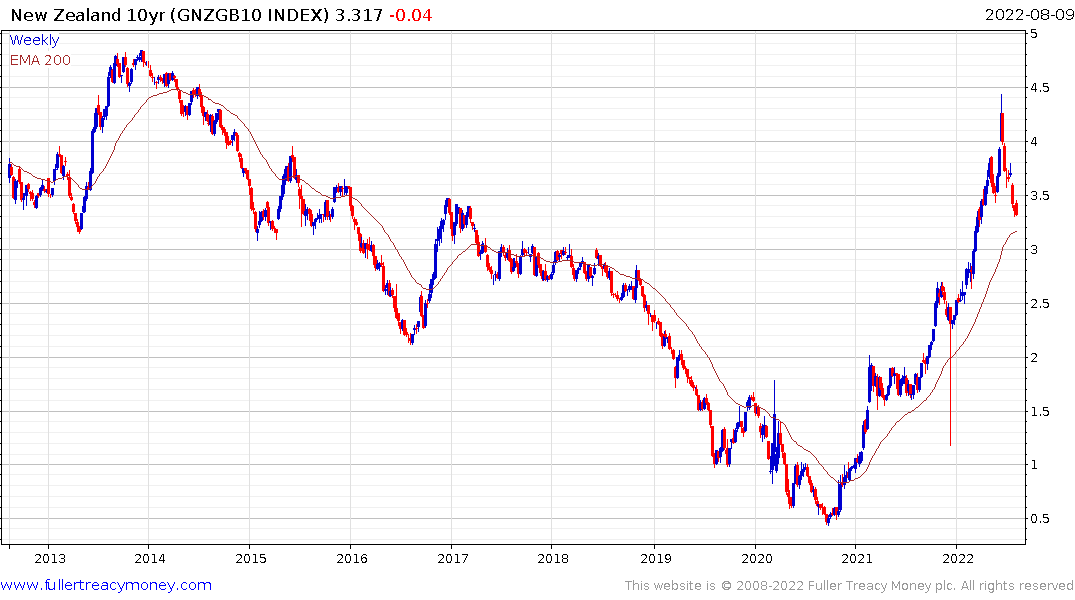
The New Zealand 50 Fully Gross Index is also testing the region of the 200-day MA while the 10-year yield is also approaching the trend mean.
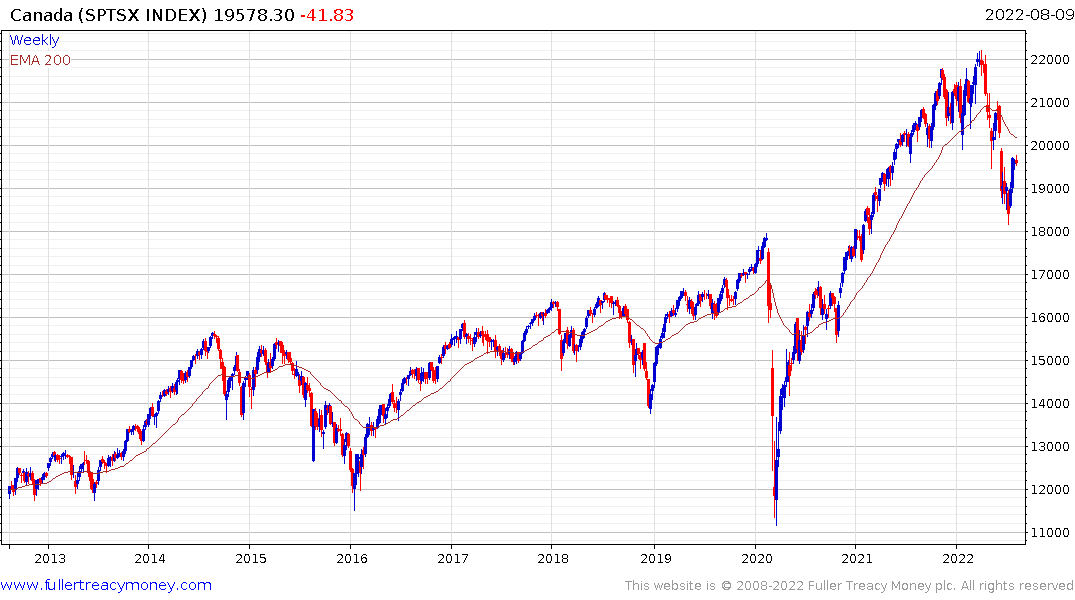
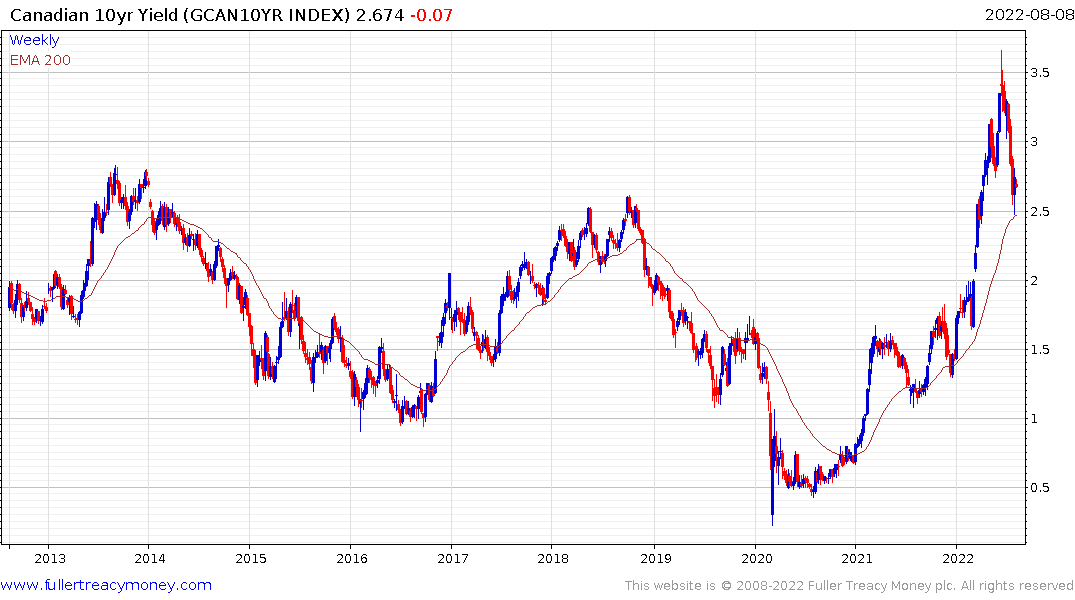
Canada’s S&P/TSX Index is pausing at the lower side of the overhead top formation. The 10-year yield is steadying in the region of the 200-day MA and the upper side of the base formation.
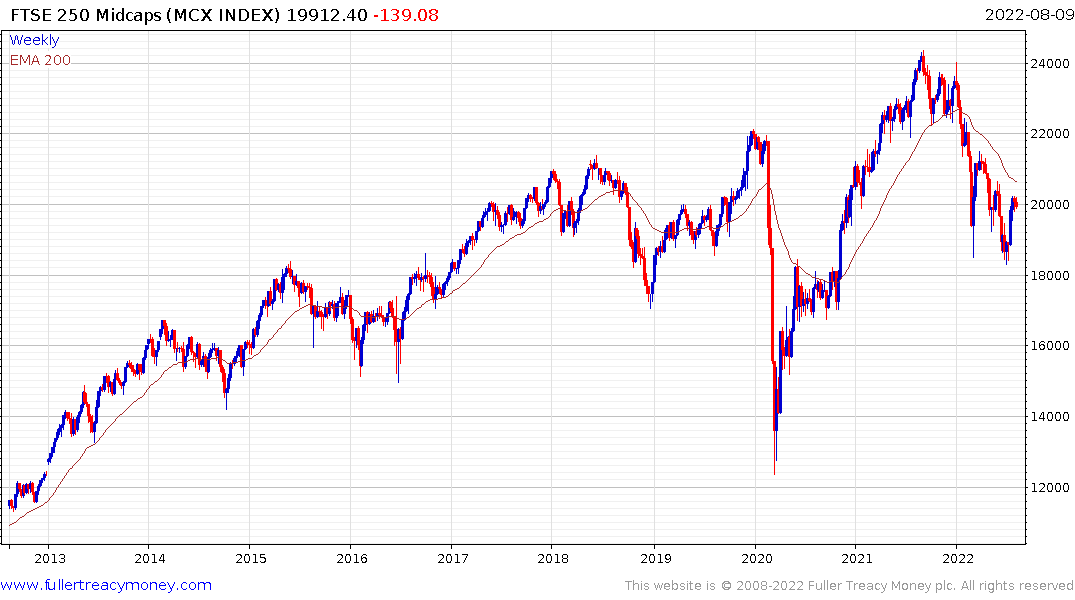
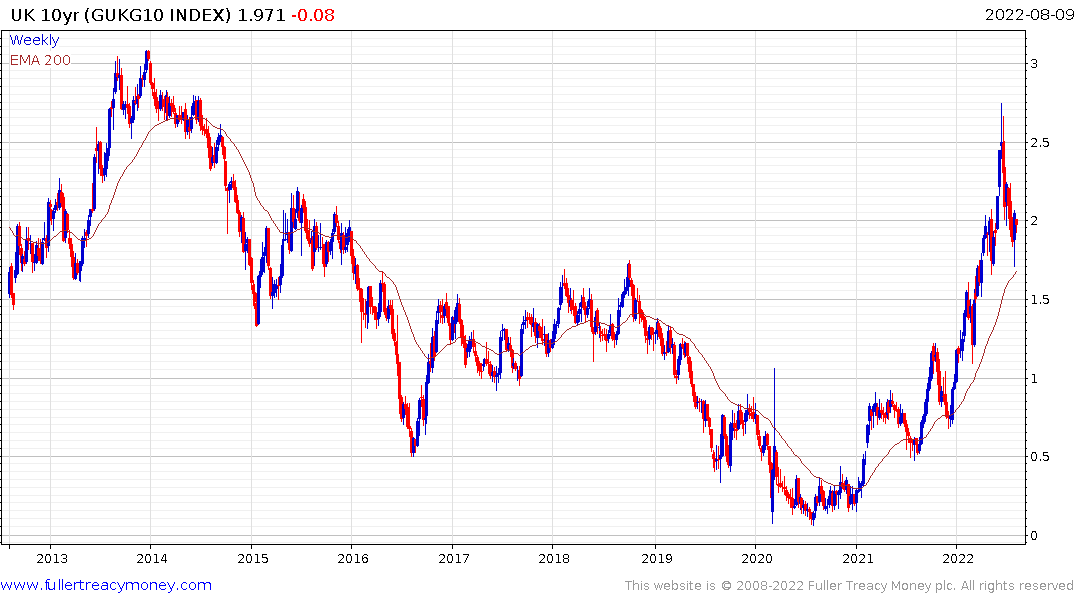
The FTSE-250 is also pausing as it tests the most recent lower rally highs. The 10-year Gilt posted an upside weekly key reversal from the region of the trend mean last week to confirm support in the region of the upper side of the base.
The strong correlations between stocks and bonds for all these markets suggest if central banks continue to raise rates from here, the chances of stock prices falling further will increase significantly.
Back to top