
Precious Metals Review
Thanks to a subscriber for this report from Deutsche Bank which may be of interest. Here is a section:
Capital allocation: We are nearing 5 years since the significant gold price (~$1,600/oz down to $1,360/oz) correction in early April 2013. The period since has largely been characterized by cost cutting, capex reduction and de-leveraging of Balance Sheets. With an average ND/2018E EBITDA ratio of 0.5x for Precious stocks under coverage, companies are largely finished with debt reduction and must now decide on the right mix of project capex (brownfield and greenfield) /exploration /dividends/buybacks/further debt reduction/M&A opportunities. Management decisions to define companies will likely diverge over the coming years and we believe this is a key consideration for investors, particularly for a sector that does not have a good record of deploying capital. In terms of dividends, companies will need to define policies that are both sustainable but also representative of variation in cash flow through the cycle, e.g., a base dividend with a supplementary dividend is most likely.
Cost pressure starting to come back: A number of companies on recent conference calls mentioned cost pressure that is entering the industry either through macro factors or through mining sector specific areas.
Examples include the increase in energy costs (mainly due to higher diesel/gas prices), some currency moves, consumables, equipment and contracting. It does not appear to be significant at this stage but the opportunities for cost-cutting initiatives seem to have largely ended (with the potential exception of technology impacts, e.g., Barrick's initiatives medium- to long-term). As an example of cost pressure, Barrick's nearterm All-In Sustaining Costs (AISC) are expected to be ~$765-815/oz for 2018, ~$50/oz higher than previous guidance of $740-760/oz. Longer term, Barrick has alluded to the fact that its target of $700/oz is going to be more difficult to achieve.

Here is a link to the full report.
The Gold/NYSE Arca Gold BUGS Index ratio hit an important peak near 10 in late 2015 which presaged the recovery rally in the metal price which broke the five-year downtrend. That undervaluation of the miners relative to the gold price represented a period of deep stress for the sector as companies scrambled to pay down debt and to keep their operations afloat. However, as the gold price rallied the miners exhibited high beta characteristics which saw them double relative to the gold price.
At today’s prices mining companies are in a much more favourable position but the ratio is rising once more as the gold price remains reasonably firm but the shares underperform in nominal terms. The major gold miners have all-in sustainable costs below $1000 so in order for the ratio to begin to contract again either the shares will rally or the gold price is set to decline.
.png)
Gold has been ranging above the $1300 area since January and has now almost unwound its overextension relative to the trend mean. However, looking at gold’s history, we can see plenty of examples of when it has overshot on the downside, particularly in the first half of 2017. Therefore, the more important level that needs to hold if potential for higher to lateral ranging is to be given the benefit of the doubt is the December low near $1235.
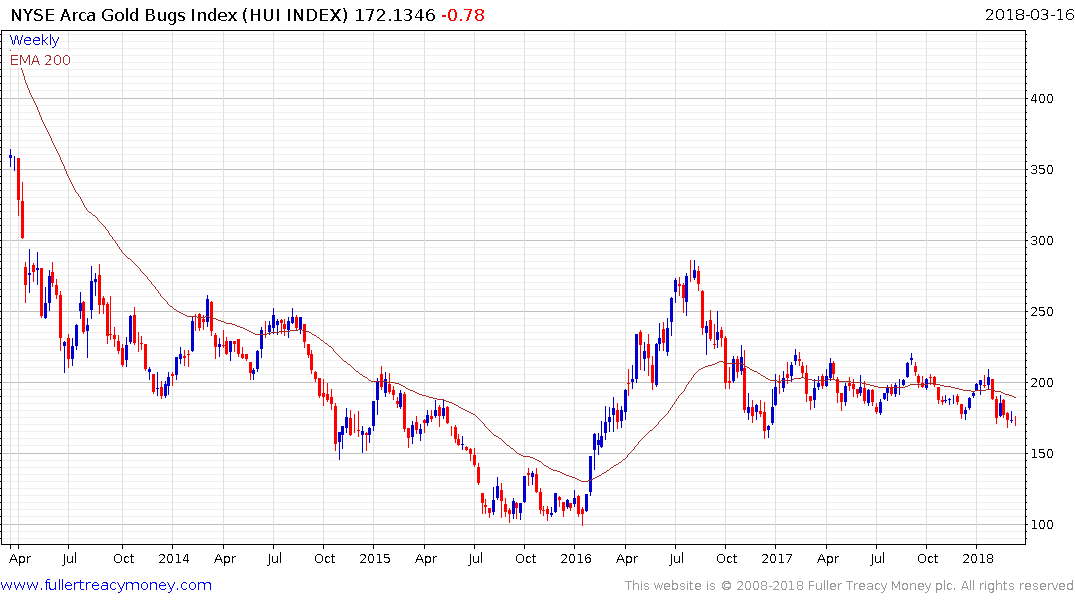
The NYSE Arca Gold BUGS Index is testing its lows near 170 and a clear upward dynamic will be required to question potential for a further test of underlying trading.
As I pointed out in a post on the 6th there a considerable number of gold miners that have highly attractive all-in production costs that will likely exhibit relative strength.
Back to top