Six ratios say this market is very overbought
Thanks to a subscriber for this timely article by Mark Hulbert for MarketWatch, highlighting a number of points we have discussed over the last months relating to valuations. Here is a section:
2. Cyclically adjusted P/E ratio. This is the version of the P/E championed by Yale University Professor Robert Shiller, the recent Nobel laureate in economics. It is calculated by dividing a company’s stock price by the average of its inflation-adjusted earnings of the preceding decade. For the S&P 500, this ratio currently stands at 25.6, which is higher than what prevailed at 29 of the 35 tops since 1900.
3. Dividend yield. This is the percentage of a company’s stock price that is represented by its total annual dividends. Since this yield tends to fall as prices rise, and vice versa, the market should register some of its lowest readings near its tops. The S&P 500’s yield currently stands at 2.0%, which is lower than the comparable yields that prevailed at all but five of the bull-market tops since 1900.
4. Price/sales ratio. This is calculated by dividing a company’s stock price by its per-share sales. Though it is lesser known, it still is championed by many investors because it is based on data that are less susceptible to manipulation than earnings. For the S&P 500, the price/sales ratio currently stands at 1.6, which is higher than the comparable readings that prevailed at all but two of the bull market tops since 1955, which is how far back data are available.
5. Price/book ratio. This is another lesser-known valuation indicator, calculated by dividing a company’s stock price by its per-share book value¡ªan accounting measure of net worth. For the S&P 500, this ratio currently stands at 2.7, which is higher than all but five of the 28 bull-market tops since the mid-1920s, which is how far back data are available.
6. Q-ratio. This indicator is based on research conducted by the late James Tobin, the 1981 Nobel laureate in economics. It is similar to the price/book ratio, except that book value is substituted by the replacement cost of assets.

We have described the cyclical bull market as liquid fuelled since at least 2009. This was in recognition of the fact that central banks were making unprecedented quantities of liquidity available and this was having the desired effect of inflating asset prices, not least stock markets.
Corporations took advantage of this situation to optimise their weighted average cost of capital and issued new debt to redeem older issues, buy back shares and increase dividends; all of which act as a tailwind for the stock market. As perceptions of economic recovery potential evolve and central banks change course to normalise policy we can logically expect some adjustment in investor behaviour.
Let’s looks at some other indicators of investor appetite for risk assets.
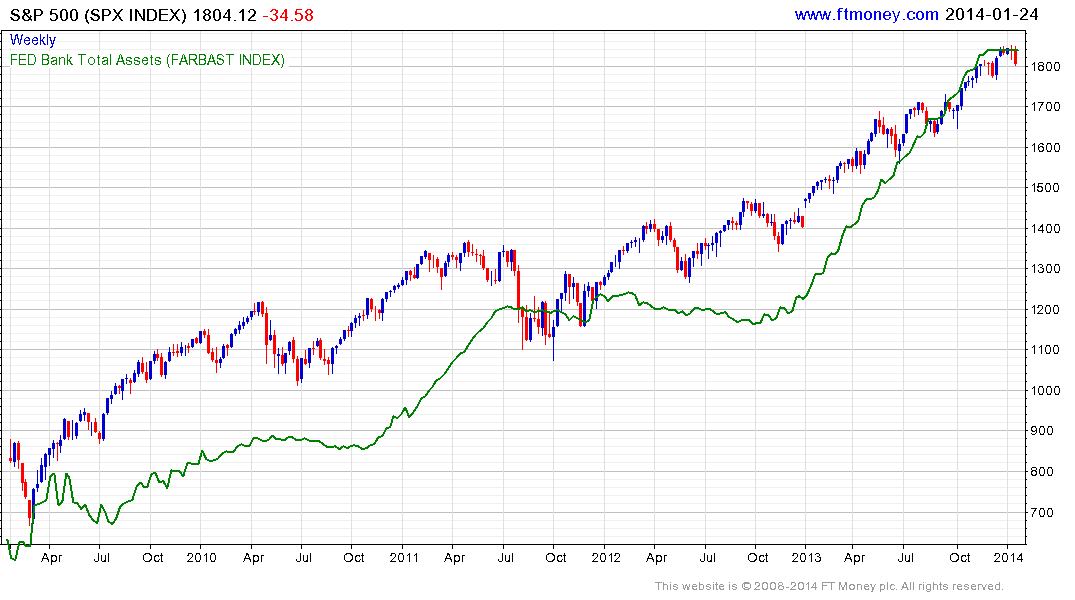
The S&P 500 overlaid with the Federal Reserve’s Balance sheet exhibits an increasingly tight correlation over the last few years. Following the announcement of tapering, the Fed’s balance sheet stopped increasing. This would suggest that what has been a steady tailwind for the market has moderated. Any market relies on new buyers to propel prices higher, what we now see is that the availability of new money to fuel that run is no longer increasing. This increases the possibility that we are at a medium-term peak.
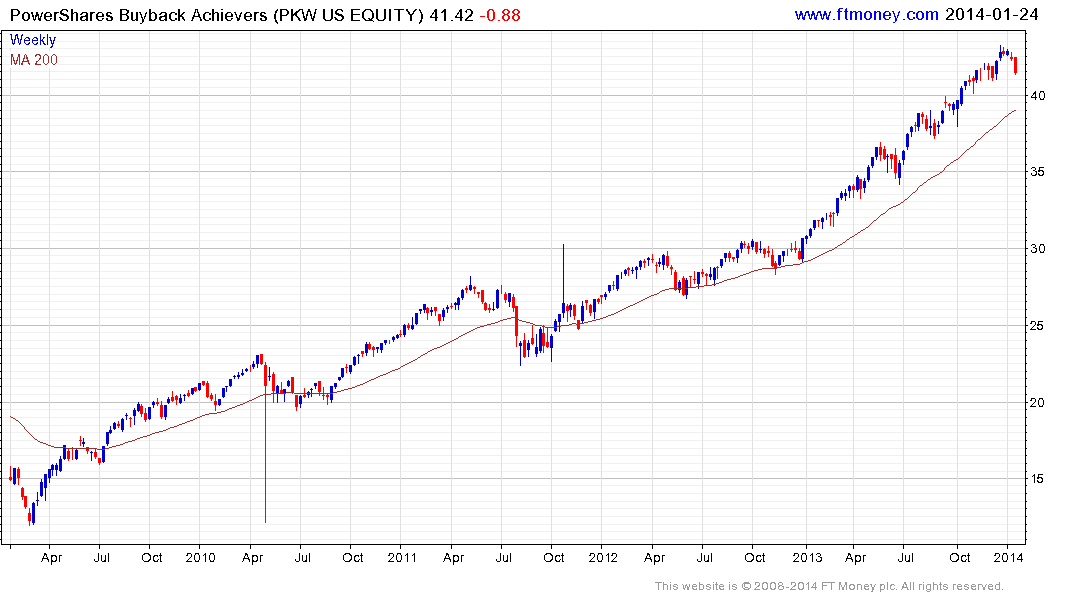
The PowerShares Buyback Achievers ETF has been an impressive outperformer and its constituents have made some of the most aggressive use of cheap credit to reduce the supply of their shares. Its remarkable advance is currently somewhat overextended relative to the 200-day MA and a clear upward dynamic will be required to question potential for mean reversion.
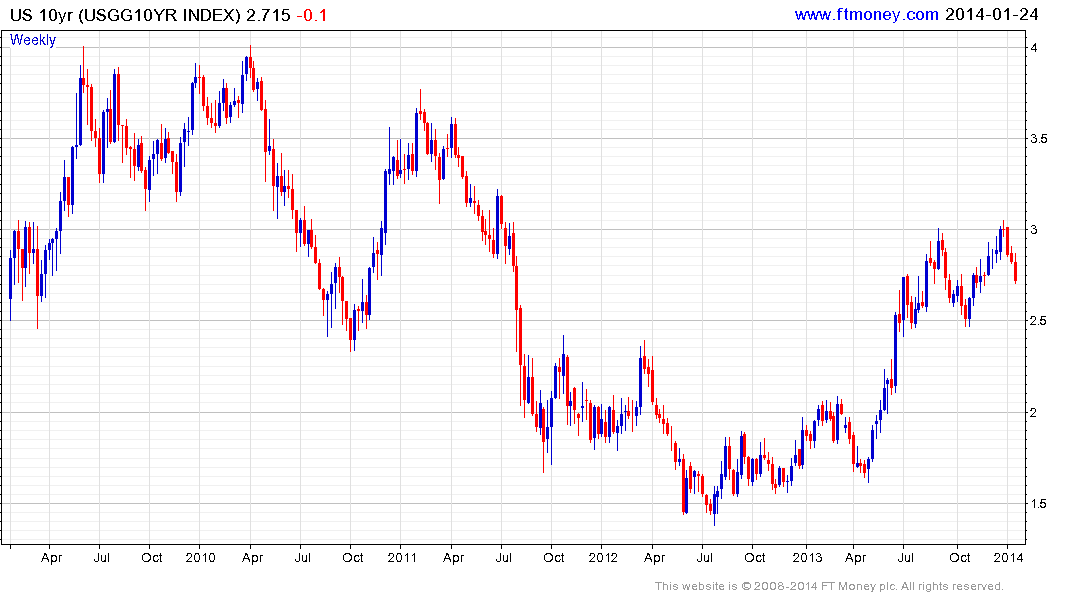
Government bond yields surged last year on speculation of the Fed’s tapering but demand for a safe haven has increased over the last month as investors take precautions against the potential for a more prolonged process of mean reversion taking hold in the stock market.
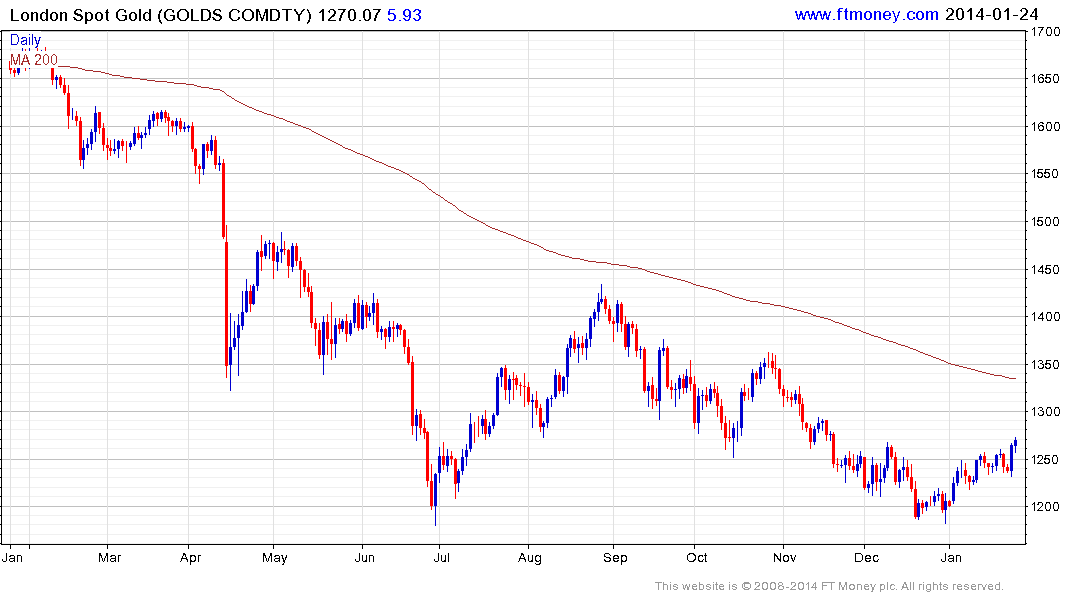
Gold’s safe haven status has also been burnished against this background not least following its decline from historic peaks.
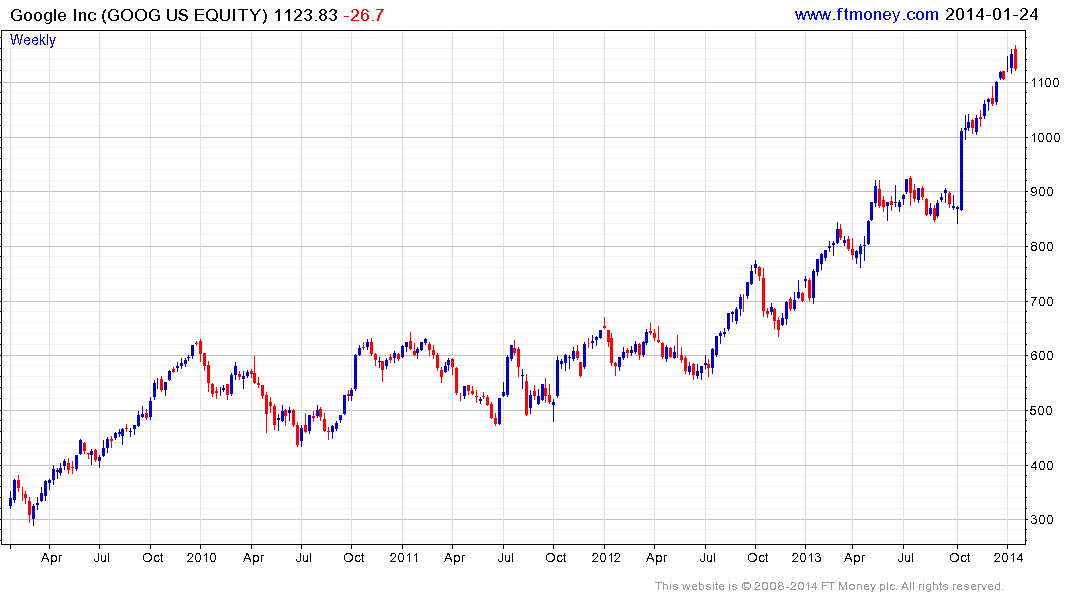
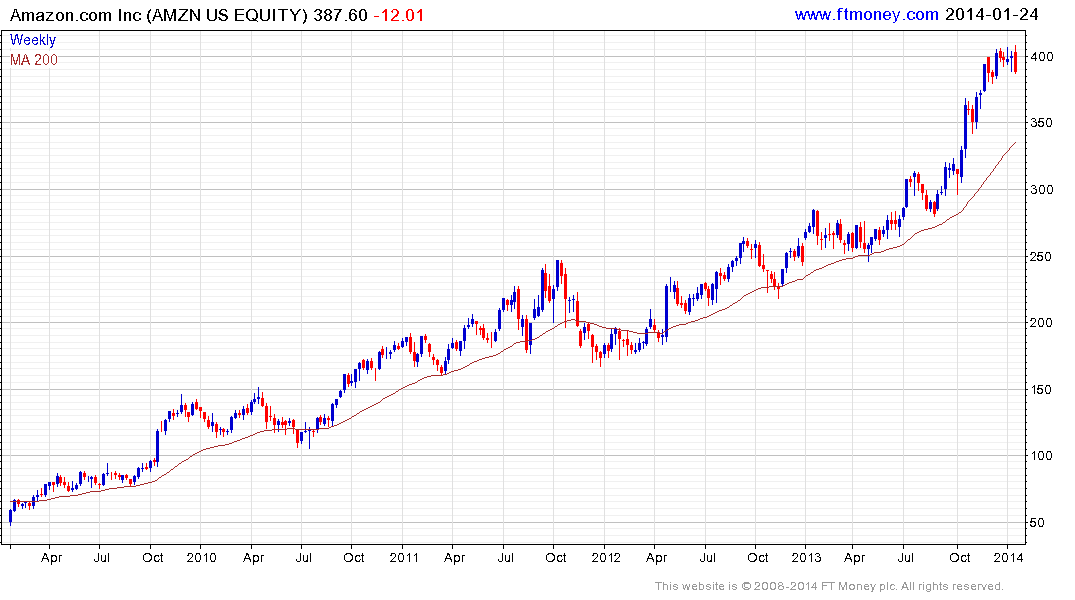
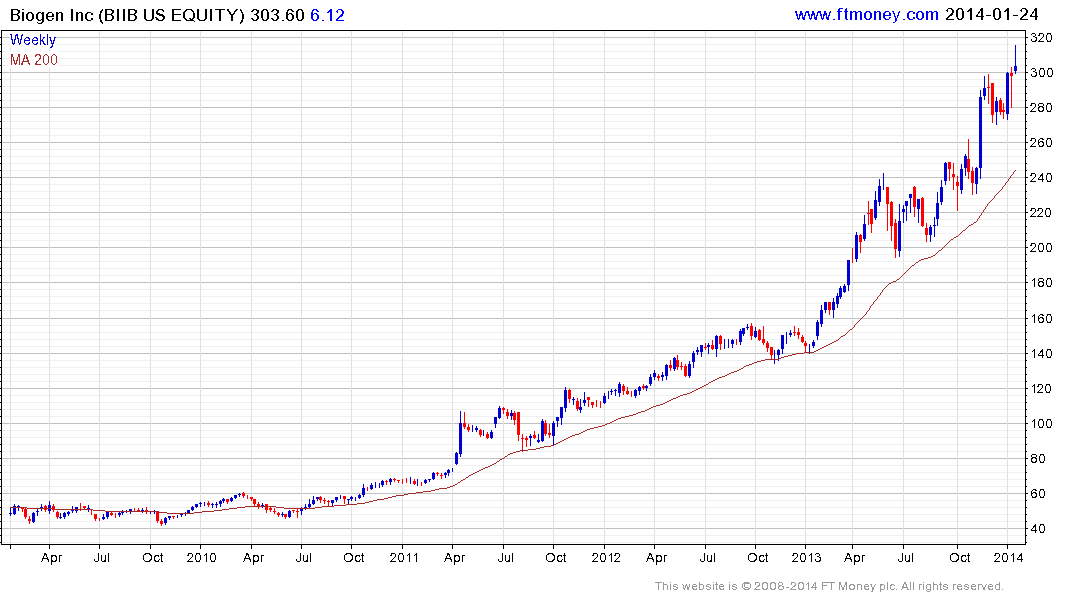
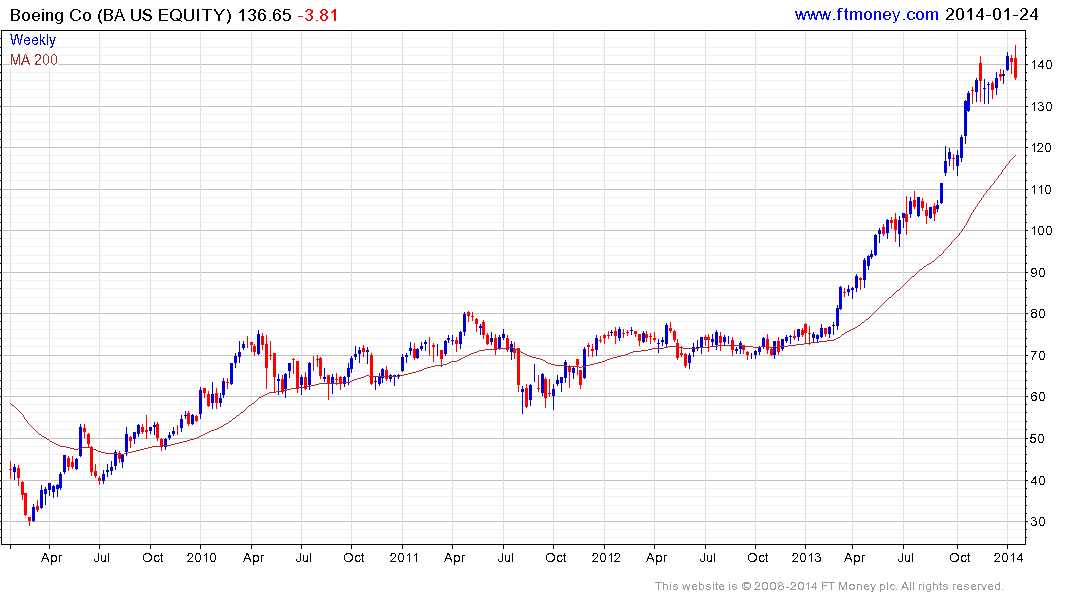
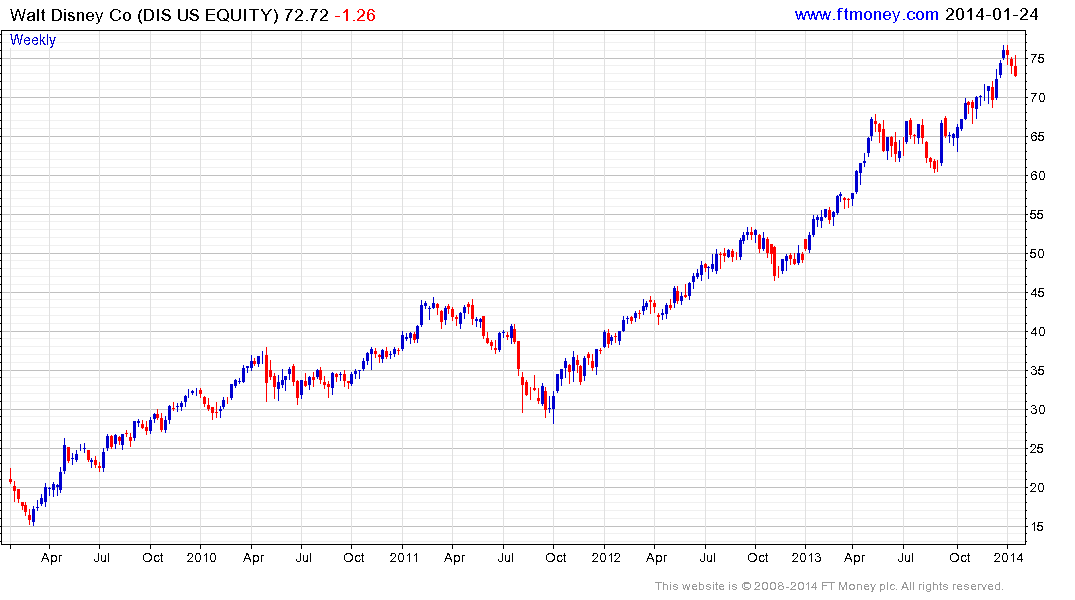
Stock market totems such as Google, Amazon, Biogen, Boeing and Disney are conspicuous by how overextended they are relative to their 200-day MAs. While it is not difficult to construct a medium-term bullish argument to support any one of these shares, the reality is that they are all prone to mean reversion.