Email of the day 2
On industrial commodities:
“Hello more than once you have said that industrial commodities are bottoming out, but looking at the crb index chart, I just don't see this. I see a descending triangle with lower highs in succession. If it maintains support I would agree, but at the moment I don’t see a bottoming process yet. Could you show which graph you are looking at? Thanks in advance.”

Thanks for an interesting question.
I usually show a shorter-term version of the CRB Continuous Commodity Index but here is a 10-year chart for additional perspective because the 500 level is technically important as you can see.
Incidentally, since I am now showing these charts in the copy rather than via a link, if you are not yet used to this presentation from Eoin’s copy, just click on each chart to increase its size.
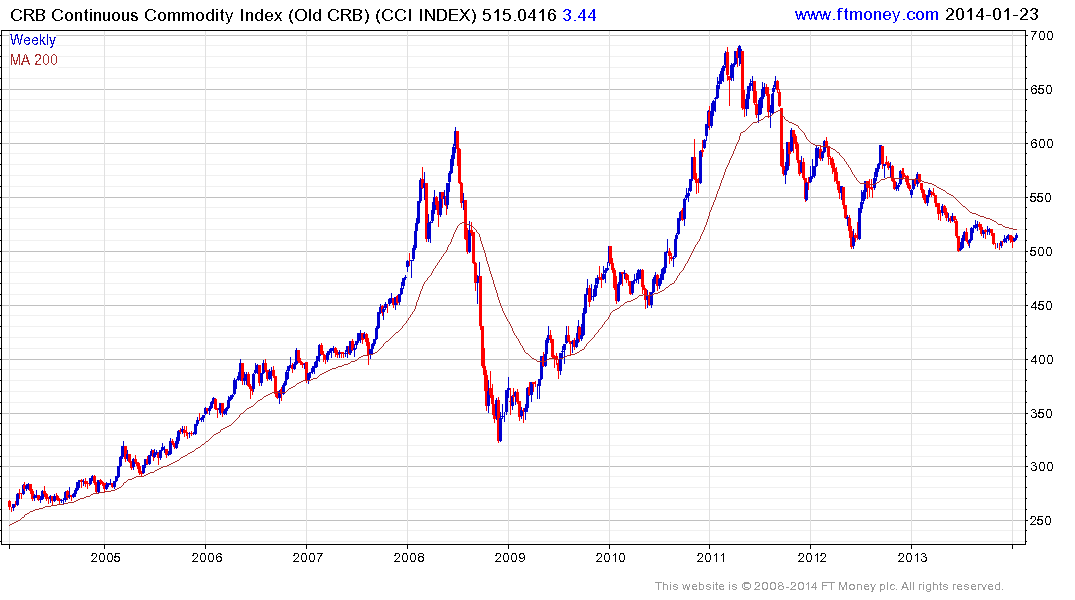
I agree that it has long had descending triangular characteristics. However, the 2012 downward acceleration was climactic, as I said at the time, and followed by a brisk rally. The subsequent retracement of that rally was more orderly, indicating more two-way activity, and the additional sideways ranging has raised the possibility of base formation development.
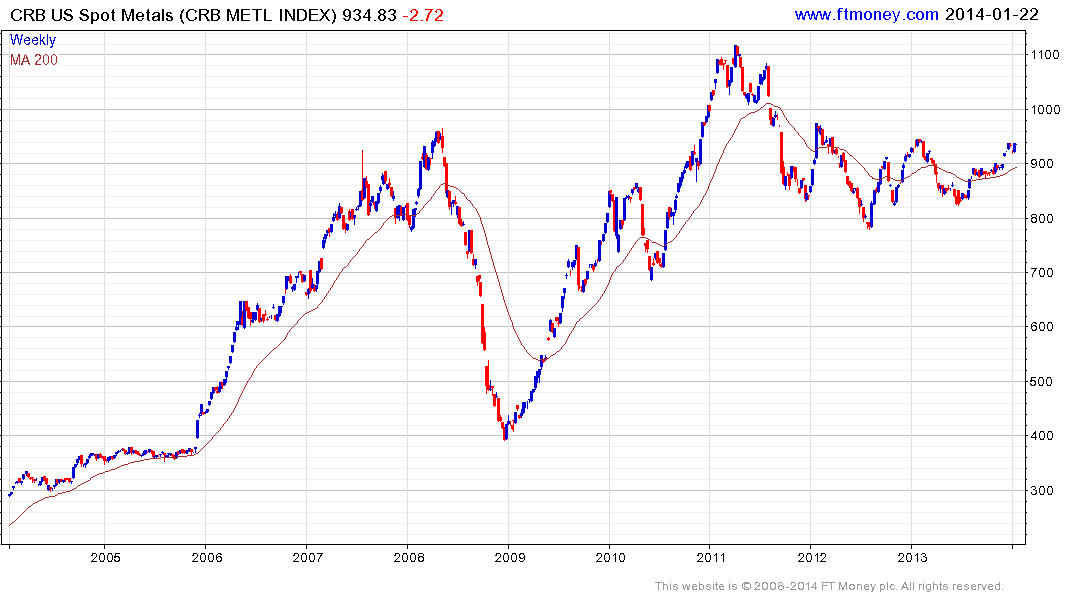
However, this CCI Index has been weighed down by agricultural commodities over the last three years. So have a look at the CRB US Spot Metals Index. It shows evidence of a saucering Type-3 base formation.