Email of the day on depicting fundamental valuations
“The Daily Commentary frequently refers to Japan shares being better value than US. The Yahoo chart shows that over the past 12 month shares on the Nikkei 225 have risen at twice the rate of the DJI. Where can the better value be shown in the charts?”

Thank you for this informative graphic which may also be of interest to other subscribers. However it is worth considering that this is a graph of relative performance in local currency terms. Rebased to US Dollars, the Nikkei-225 is up 26.49% year-to-date compared to the S&P 500’s 26.8%. This helps to highlight the point of how important currency hedging is if one wishes to benefit from Japan’s commitment to end deflation.
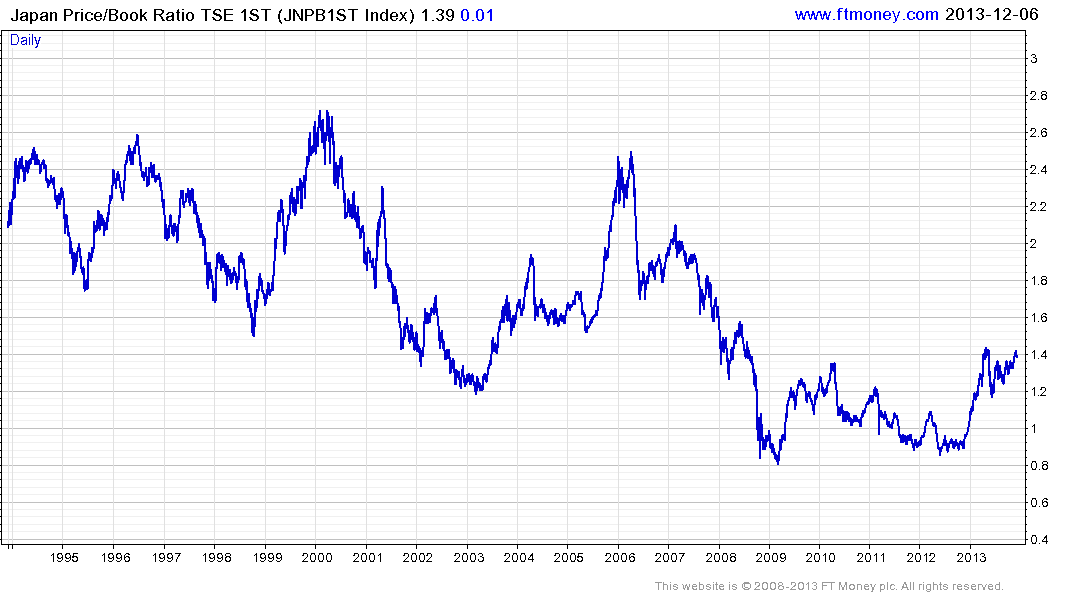
Returning to your question of how to depict value, price to book (P/B) is one of the more reliable measures, not least on a relative basis. The Topix 1st section’s P/B ranged above 1 for much of time between 2009 and 2012, when it broke out. The ratio continues to have a high correlation with the wider Japanese market. (Also see David’s comments above.)
This chart of the S&P 500’s P/B highlights the fact that at 2.63, US shares are more expensive than Japanese shares, at least by this measure. It is perhaps also worth considering that the 3 area for the S&P has offered resistance on successive occasions since 2003.