
Email of the day - on money printing
As an American investor, it has occurred to me that as we enter an era of money printing the likes of which we probably have never experienced, I really don't have a good handle on the potential risk. It is virtually impossible to allocate one's assets appropriately without a good understanding of a "best case/worst case" scenario. I watch as those in charge in Washington salivate at the prospect of writing checks, checks, checks, and assume that the currency will depreciate, but wonder: how bad might this possibly get? With a pistol to your head, if you had to take a guess at it, what do you see as the range of possibilities here? Might we be another Greece? Thanks for all you do for us - day in and day out.

Thank you for this question which helps to express the uncertainty many people feel after a year of outsized volatility across assets…everywhere. Trillions of dollars in deficits will need to be funded somehow. Right now, the plan is to print the money and devalue the currency. Comparisons with Greece, Zimbabwe or Venezuela miss the point. The USA prints debt in its own currency. It will never default. All of the pressure will be borne by the Dollar.
.png)
The Dollar’s Purchasing Power peaked in 1933 and halved by 1948 (15 years). It halved again by 1974 (26 years). It halved again by 1983 (9 years). It halved again by 2007 (24 years) and is well on its way to another halving.
There is a cottage industry in worst case scenarios and I am reluctant to indulge in that kind of speculation. The one thing we know for sure is investors are being forced to speculate. Cash is a wasting asset when devaluation is in play. That is creating demand for hard assets and preferably those with strong cash flows.
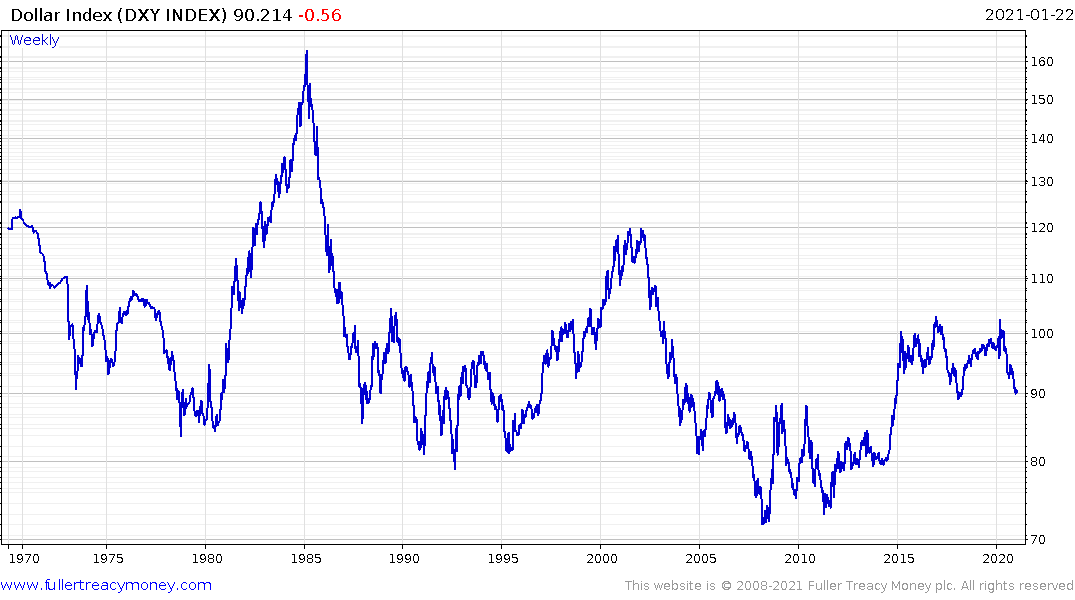
The Dollar Index tends to move in seven-year bull and bear markets with churning for a couple of years in between. The last significant peak was in 2017 with a retest last year. Therefore, I do not expect to see a meaningful low in the Dollar for at least another five years. By that time, I expect the Bloomberg Dollar Index to have made a new all-time low.
There is clear potential for non-US assets to outperform in a meaningful fashion as that trend develops in constant currency terms. At present we are in the transition phase. The Dollar has not broken down yet but major global indices are breaking out of very long-term ranges as their respective currencies strengthen.
The important thing to remember about periods where cash is abundant is it is rising tide that lifts all boats. Relative performance is likely to favour global markets, but Wall Street can still rally in nominal terms. The time to become truly anxious is when no one is expressing fear. That’s not today despite the fact we have short-term overbought conditions and examples of overexuberance among retail investors.
The question I have raised in the long-term audio was what would happen when people who were making more from unemployment benefits went back to work for less money. The incoming Biden administration quickly answered the question. $15 an hour minimum wages for everyone for a 40-hour week is equates the $600 benefit many enjoyed during lockdowns. There has been no commentary on the fact it pushes much higher costs onto struggling businesses and will catalyse the decision for many small businesses to stay closed.
The way I see it either 2020 was like both 1969/70 and 1998. After both periods of turmoil, we had significant rebounds in asset prices.
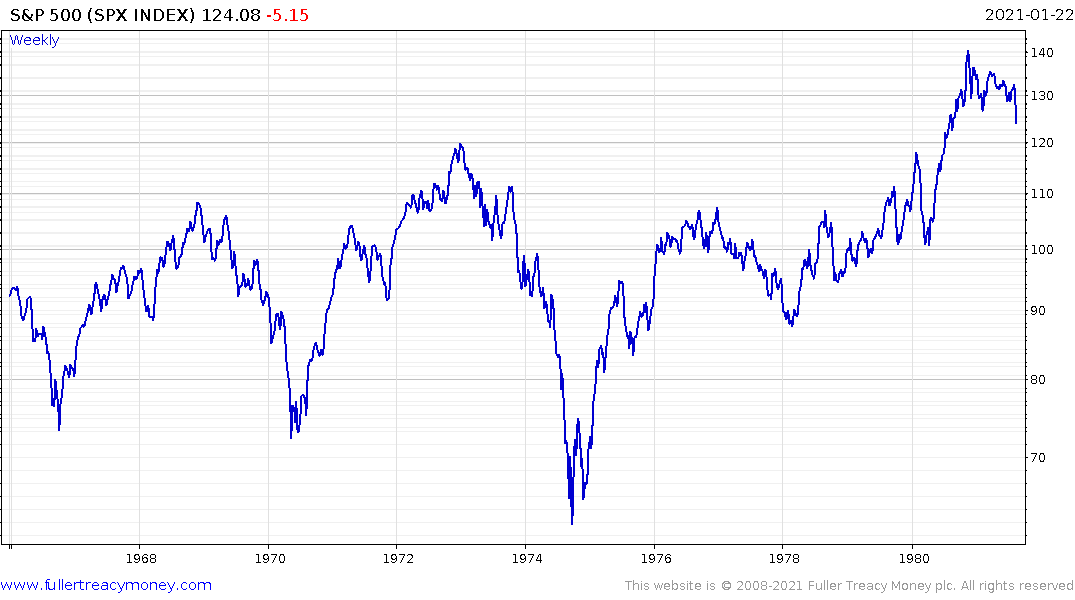
If it is more like 1969/70 we are the dawn of an inflationary spiral which will eventually take a heavy toll on overvalued financial assets that rely on access to liquidity for their business models. However, you get the post crisis boom first. Between the low in 1970 and the peak in 1973, the S&P500 rallied 73% before halving.
.png)
If it is more like 1998, we see a bubble form in a segment of the market but without the inflationary consequences. Between the low in 1998 and the peak in 2000 the S&P500 rallied 68%. The Nasdaq-100 went up 352%. In that scenario the biggest risk is Tesla, Amazon and the likes of Uber etc. All of these companies can broadly be defined as consumer discretionary.
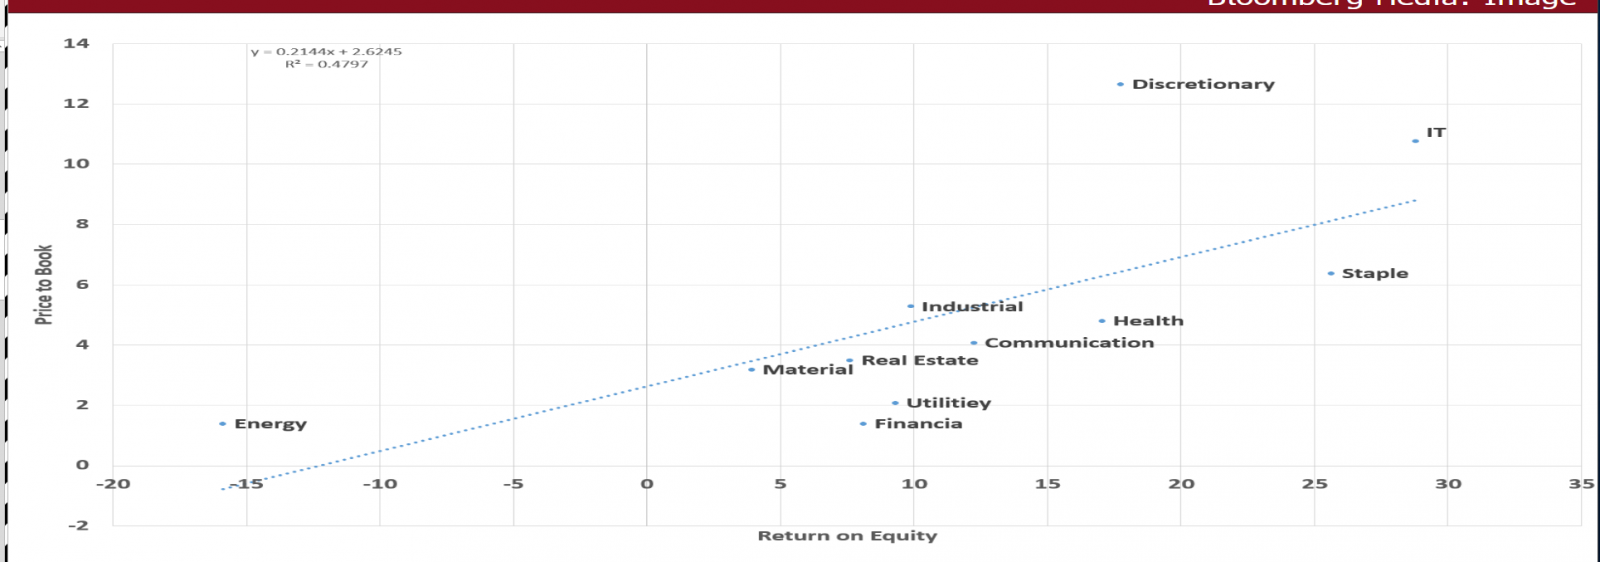
This chart from UBS offers a handy representation of where the bubble candidates reside.
.png)
From the low in March the S&P500 is currently up 76%. The IPO ETF is up 247%. This performance is a is a testament to just how much money has been printed. With more money the bubble can be bigger.