
Email of the day - on inverted yield curves
how is the Yield Curve inversion? The famous inverted US yield curve - only when measured by 3mth/10y (NOT 2y/10y) - has been a reliable predictor of US recession 12-24 months ahead when measured from start point and provided inversion lasted more than 3mths. So somewhere between May 2020-May 2021 we should expect recession. History suggests that this inversion always reverses well before recession arrives. Mainly because Fed eases short rates to avoid recession. So, déjà vu?? Regards

Thank you for this question which may be of interest to other subscribers. The question of the yield curve and how good a lead indicator it is tends to be discussed and dismissed before every recession. This occasion has been no different and it would be foolhardy to think boom and bust have been banished just because some Davos attendees have proclaimed it so.
Nevertheless, there are differences today we had not seen before. For example, look at these three charts of what the yield curve looked like in 2000, 2007 and now.
The first two are broadly similar, the current pattern looks more like a belly in the curve than a classic inversion. The spread typically used by the Fed is the 10-year - 3-month and the 10-year - 2-year is the one most often used by investors. What we can certainly conclude is the Fed is paying attention to the signal on this occasion whereas they ignored it on previous occasions. In fact, they are doing whatever they can to avoid a contraction which greatly enhances potential for a true bubble to form.
One of the most important points about the yield curve signal is the market tends to rally immediately after the inversion as investors price in easier monetary policy in future. From the first inversion in 1998 to the stock market peak in 2000 the market went up 54%. In 2006, the advance from the first inversion to peak in 2007 was 24%. From the first inversion of the 10-year-3-month in March 2019 the advance has been 18.8%.
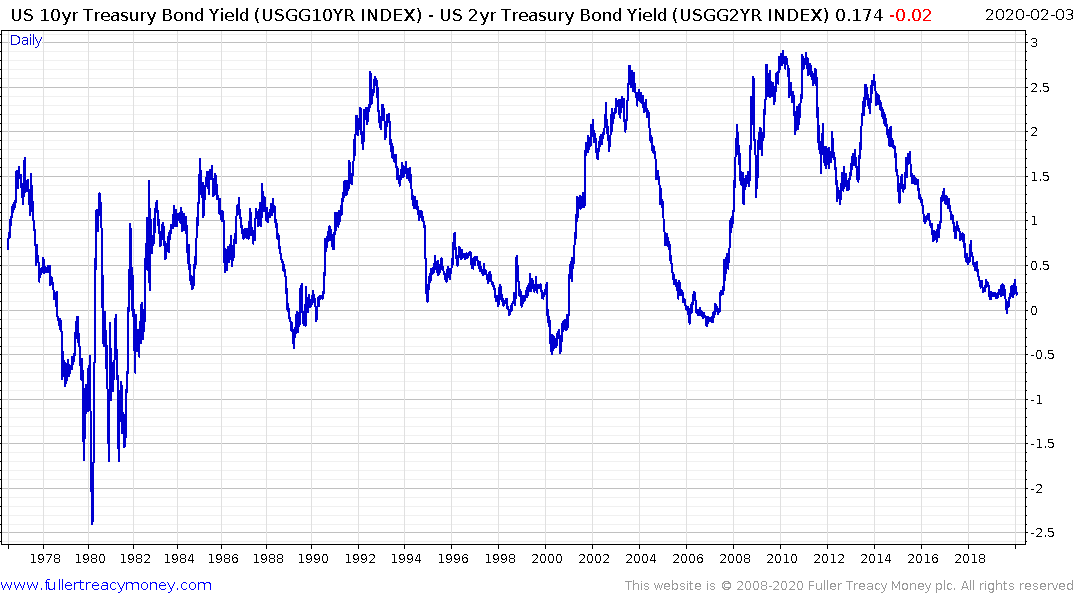
The most urgent signal that the liquidity fuelled advance is over is when the 10-year - 2-year spread surges higher and through 50 basis points. That generally coincides with panic at the Fed that they are behind the curve as a contraction takes hold. With spreads currently contracting rather than expanding momentum is still on the side of the bulls.