
Email of the day on low interest rates driving the stock market
I was listening to a podcast at Epsilon Theory and they were discussing their observation of S&P EBITDA growth being significantly lower than Net Income growth. This would signify that the artificially low interest rates being the prime driver of earnings which poses a scary scenario. I can't seem to find an updated chart. Can you add to the Chart Library? Thank you!

Thank you for this question but I’m afraid the universe of fundamental statistics we have available to post in the Chart Library is rather limited so creating the spread between EBITDA and Net Income is not possible.
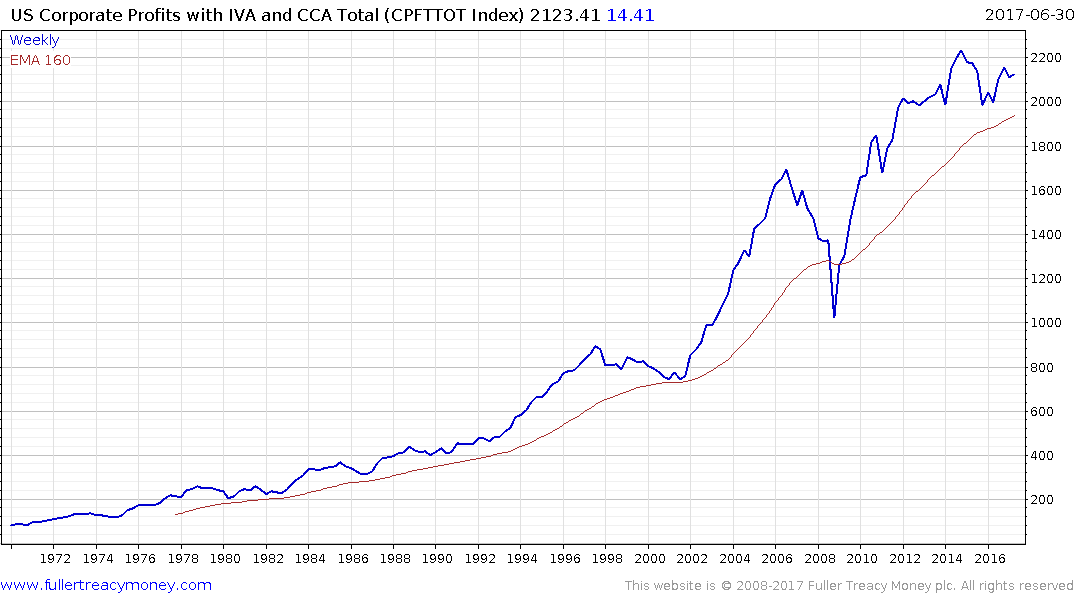
However, if we address the chart of US Corporate Profits we can see that it has lost momentum over the last few years. Meanwhile expectations are for EBITDA to rise sharply over the coming quarters which could result in corporate profits improving. If that does indeed turn out to be the case it will lend additional fuel to the rally, whereas if the data remains rangebound it will exacerbate reliance on expectations for monetary and fiscal largesse.
Here is a section from a report by Albert Edwards for SocGen which may be of interest:
I certainly believe QE has also inflated US corporate debt prices way above what they otherwise should be. Indeed looking at the top left-hand chart above, it is clear that typically, the corporate debt market would be in revolt by now in the face of the cyclical debauchment of corporate balance sheets. The fact that both yields and spreads are near all-time lows is, like over-extended equity valuations, a ticking time-bomb waiting to go off. (The chart on the left uses top-down corporate balance sheet data from the Federal Reserve Z1 Flow of Funds book. But the right-hand chart is stockmarket data from Datastream and shows a higher peak recently for quoted stocks, tying up closely with Andrew Lapthorne’s bottom-up analysis.)
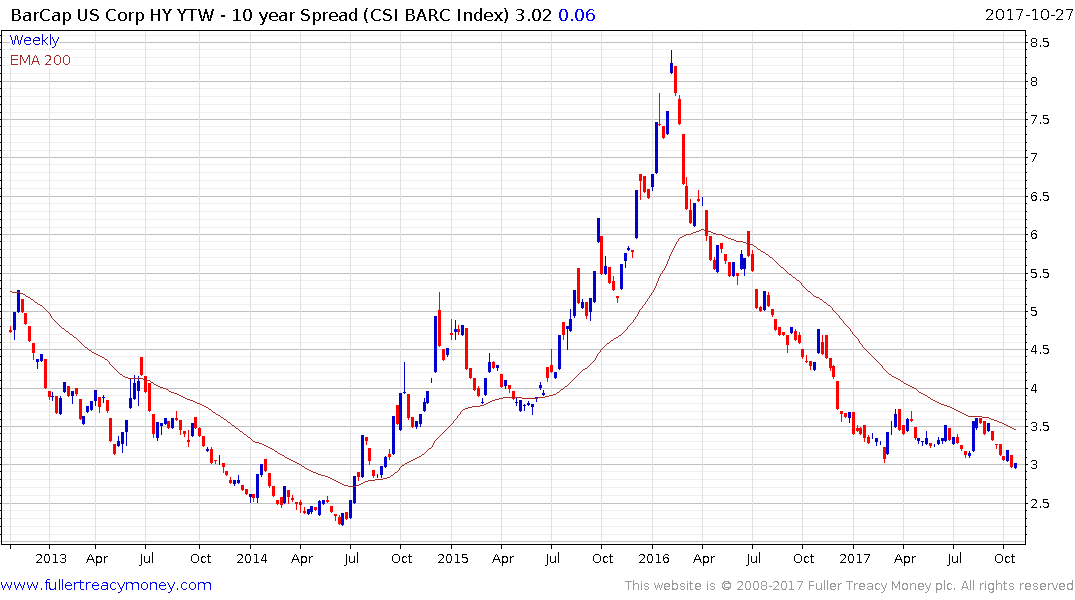
The Barclays High Yield Spread chart continues to post new lows so while we can recognise that there are a number of issues which could contribute to trouble in the future they are not yet exhibiting warning signs of imminent danger of a recession. Nevertheless, there potential for a pause and consolidation in line with the consistency of the step sequence uptrend which has been underway for most of this year.