
Point and Figure Charts for FANGMANT

P&F charts don’t typically have time stamps, but the following charts incorporate at least 20 years of data where relevant. P&F charts only measure the movement in price up and down. We typically use 3 box reversals. That means the column will proceed to rise or fall until the price move three units of scale in the opposite direction on a closing basis. The benefit of P&F charts is they cut out the noise of inert ranges.
Meta Platforms (Facebook), Apple, Netflix, Alphabet (Google) Microsoft, Amazon and Nvidia represent almost 22% of the entire market cap of the US market. Since ETF buying has been one of the hallmarks of the bull run since 2009, it is reasonable to expect most investors have a position in these shares whether they are aware of it or not.
I thought it would be a useful exercise to look at the charts of these companies using p&f charts because they tend to give clear signals at major turning points.
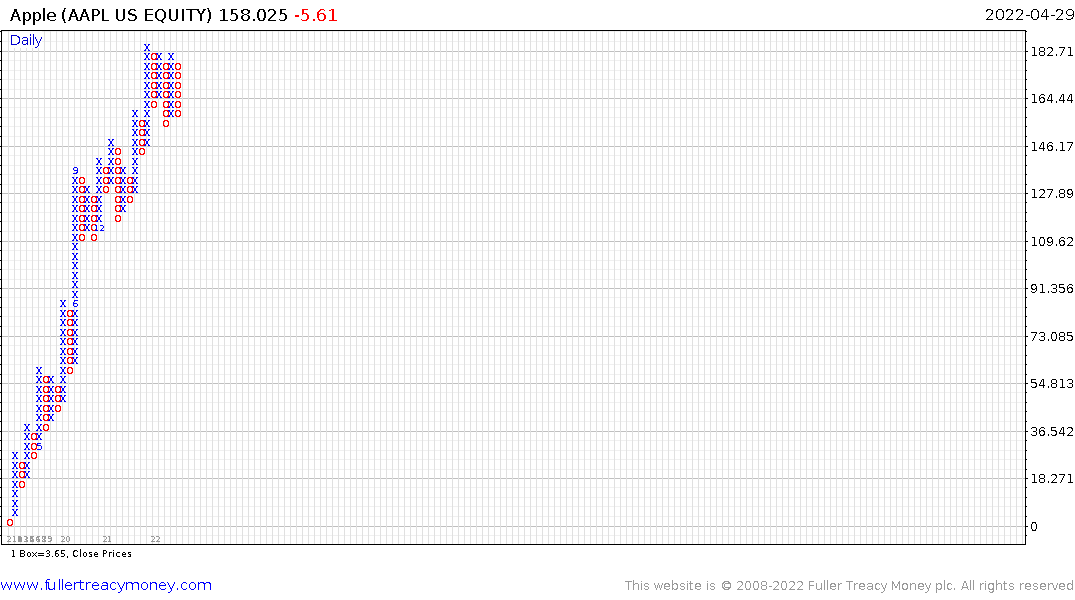
Apple has been trending higher in a consistent manner. Throughout this trend no range has been more than four columns wide and it follows a broad staircase uptrend. There have been a couple of instances where the price dipped back into the underlying range, but they were not sustained, and a Mid-point Danger Line stop would not have been triggered.
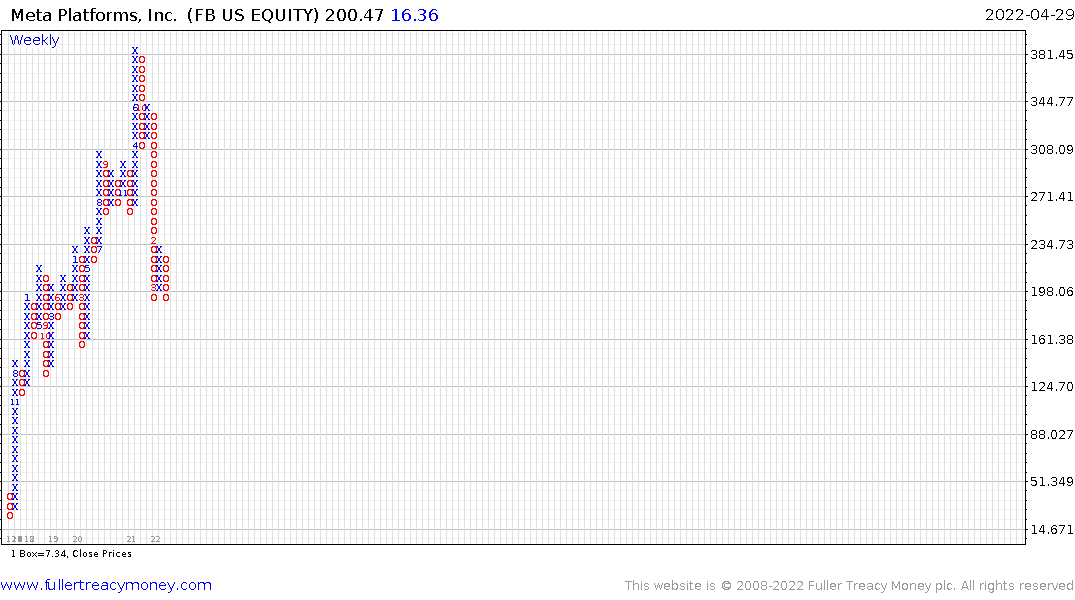
Meta Platforms (Facebook) trended higher in an inconsistent manner until the peak in late 2021. It failed to hold support at the upper side of the underlying range and collapsed. The share attempting to build support but even yesterday’s impressive rebound was not enough to start a new column of rising x’s.
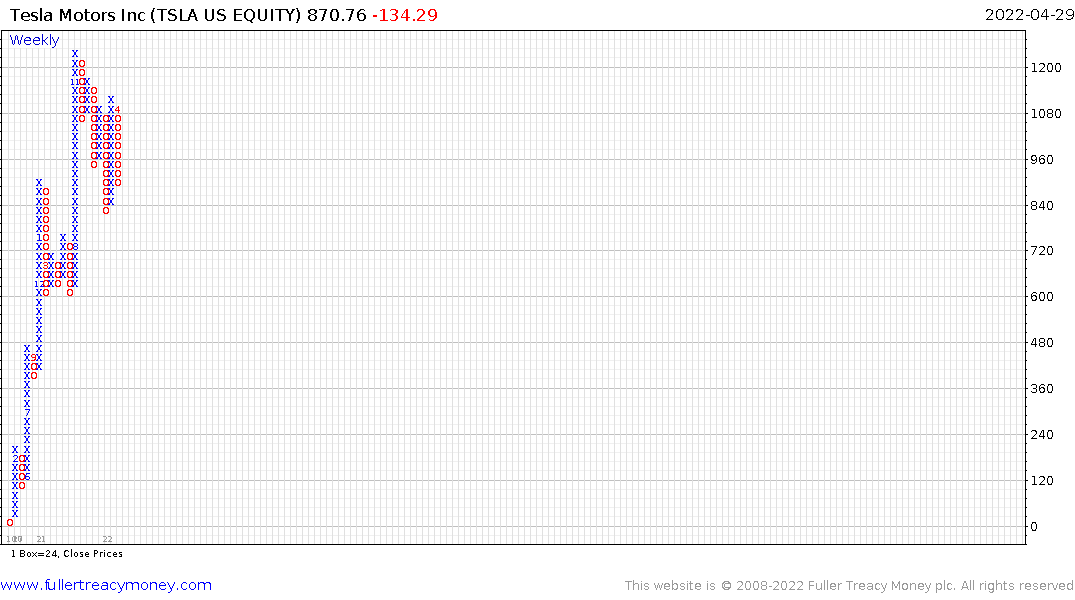 Tesla is an extraordinarily volatile share. Following the surge to new all-time highs, a sequence of lower rally highs has been evident. A sustained move above $1150 will be required to signal a return to demand dominance beyond steadying.
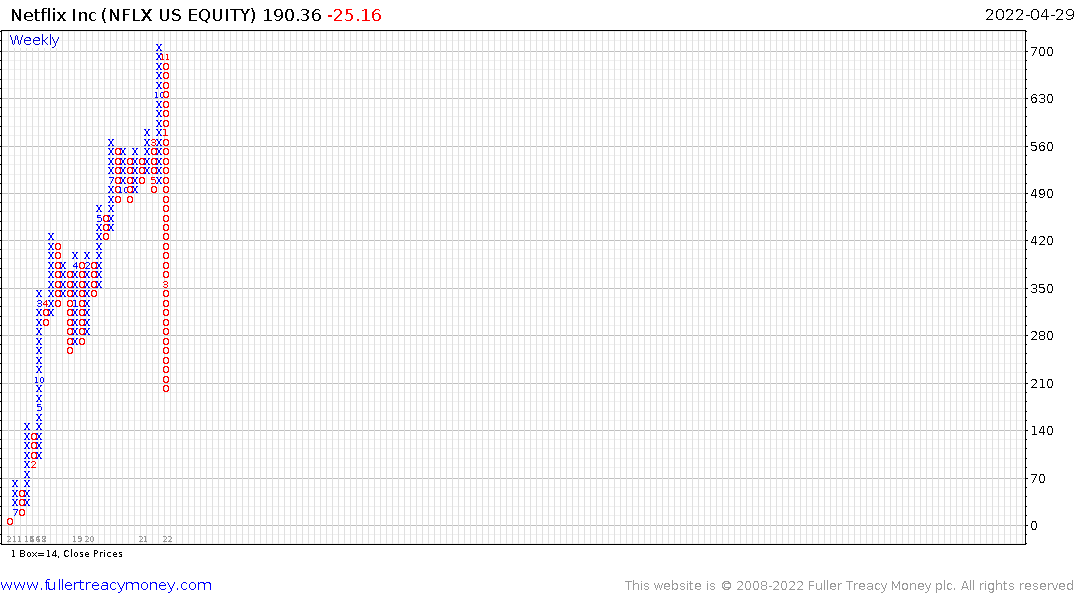
Netflix failed to sustain the breakout to new highs earlier this year and has come straight down. This is a crash and there is no sign on the chart that it is over.
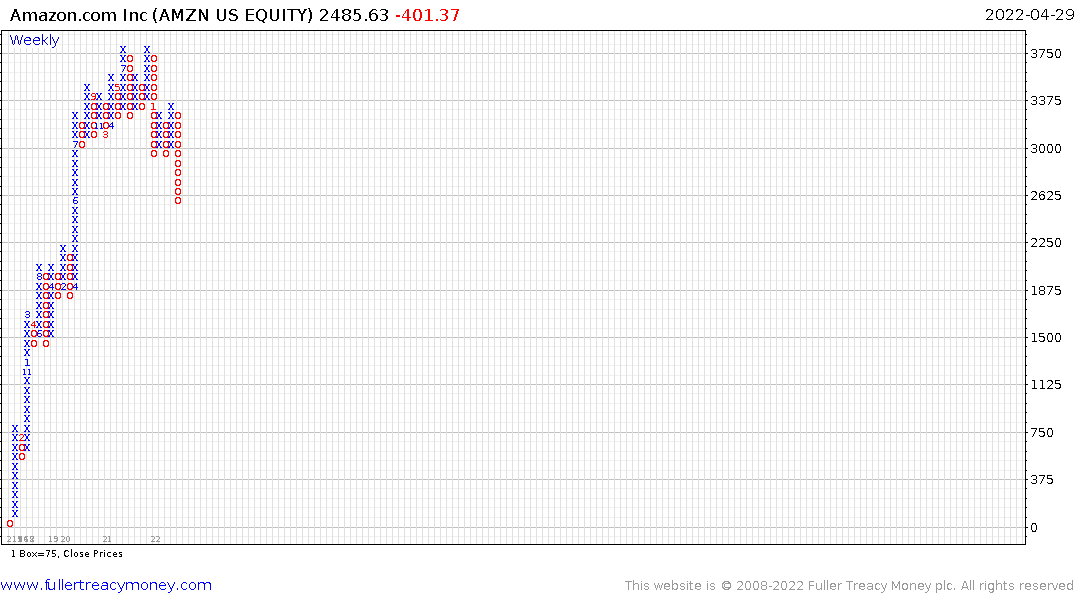
Amazon has experienced medium corrections in the past, but the most recent range has clear type-2 top formation characteristics with a series of failed upside breaks, the wider range, massive reaction against the prevailing trend, brief period of right-hand extension and breakdown today.
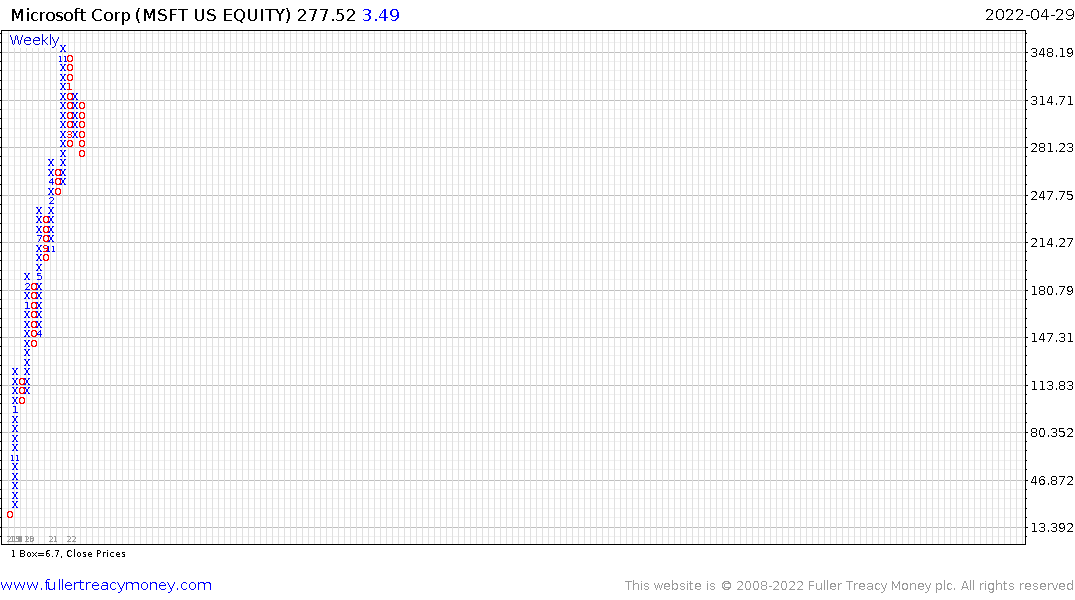 Microsoft posted a steep but consistent uptrend until the big decline earlier this year. It has now posted a lower high and lower low. It is testing the upper side of the underlying trading range. It has already lost most of its uptrend consistency and will need to bounce emphatically soon to reverse the emerging downtrend.
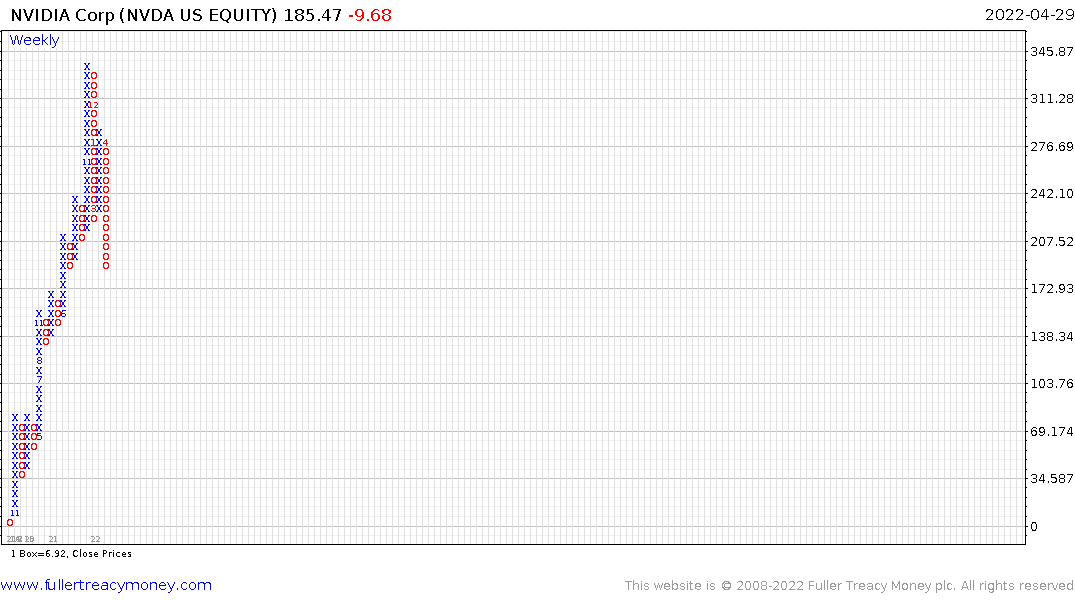
Nvidia trended higher in a consistent manner and accelerated higher during the pandemic. Following a steep decline from the peak, it posted a lower high, then dropped down to break the sequence of higher reaction lows to break the uptrend.
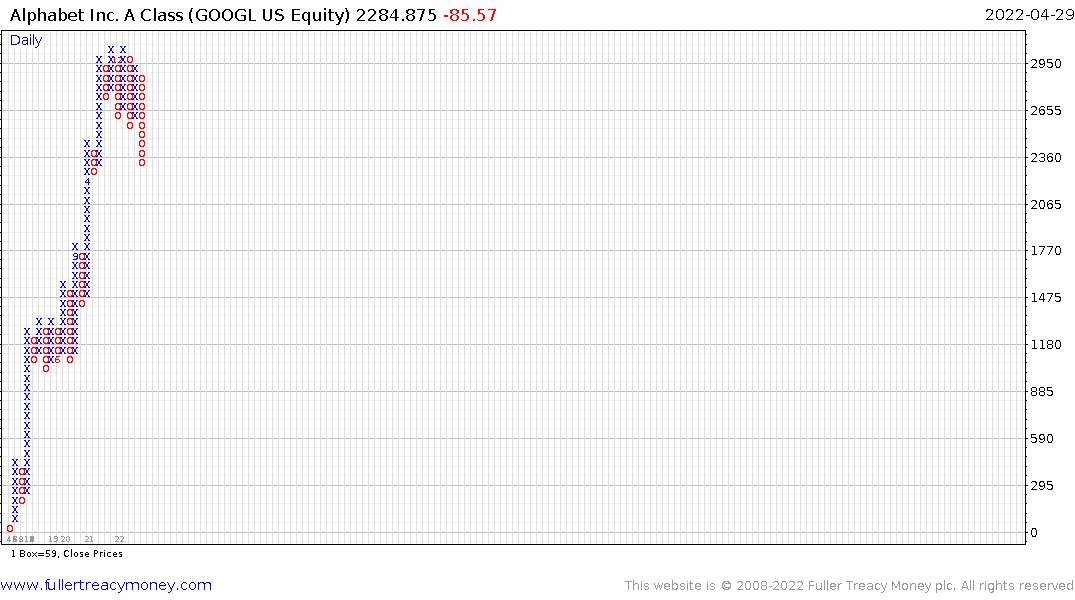
Alphabet also accelerated during the pandemic. It ranged in a reasonably tight manner until this week and broke lower. With a sequence of lower highs and lower lows this is a downtrend.
There is one clear message from the above charts. Apple is the only chart that is still in a reasonably consistent uptrend, but emerging downtrends predominate among the other seven shares.
The coincidence of tightening monetary and fiscal policy with the underperformance of mega-cap shares is not a mistake. These companies did best from the abundant liquidity conditions of the last decade and are suffering as the regime changes.
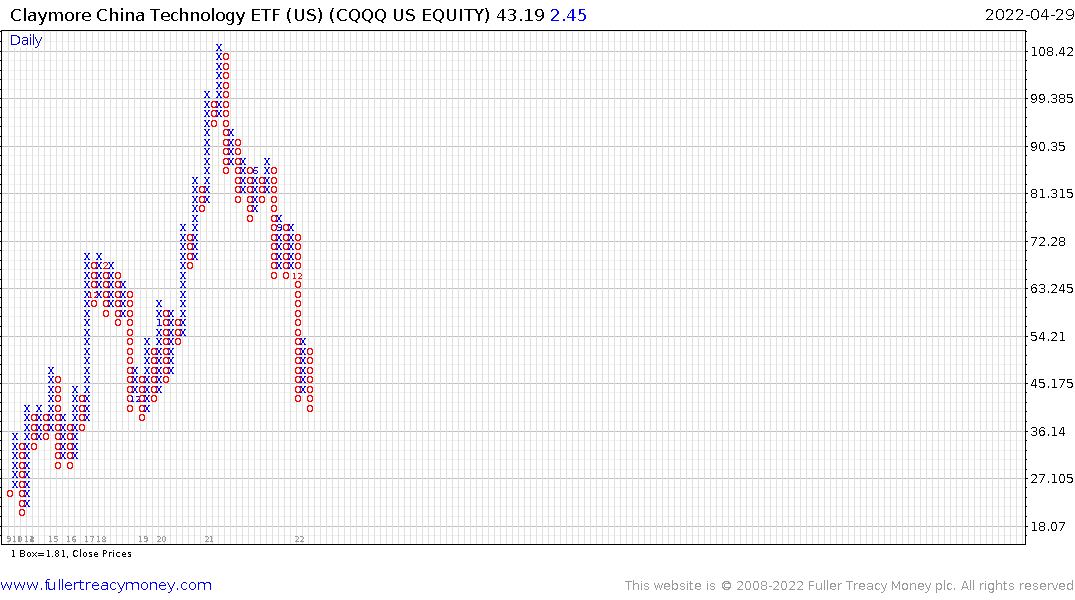
It is worth considering interest rate hiking and balance sheet reduction programs have barely begun, but the growth segment of the market has experienced a deep decline. China offers an example of what to expect. The large cap tech sector is unlikely to attract significant interest until the Federal Reserve declares victory over inflation and stops reducing the size of its balance sheet.
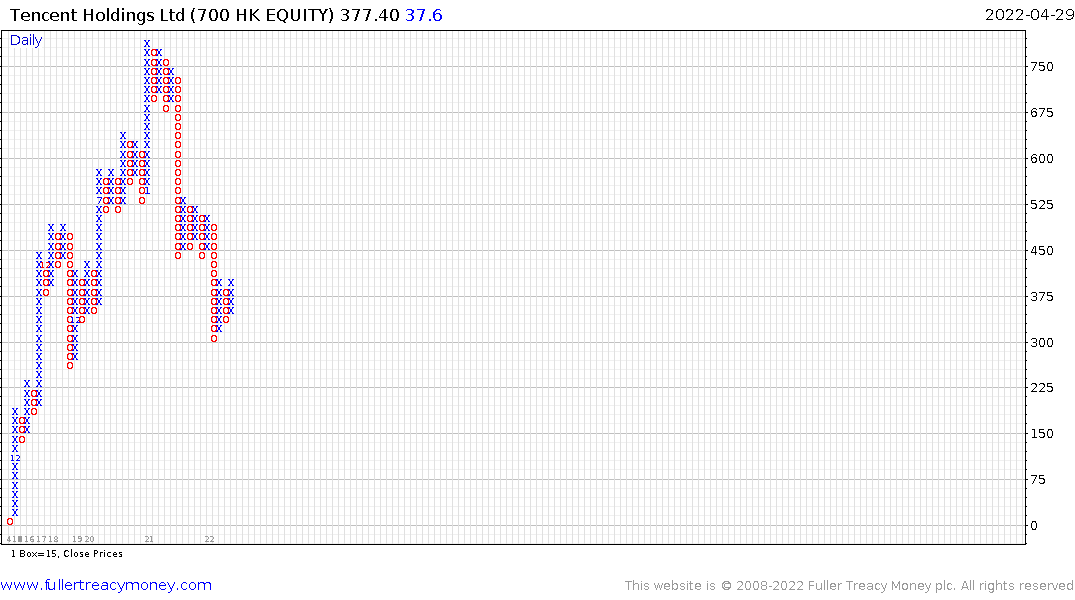
Tencent is beginning to show evidence of support building. Meanwhile the four best performers on the Nasdaq-100 today were all Chinese tech companies as the prospect for stimulus improves.