
One Section of the U.S. Yield Curve May Invert as Soon as Today
This article by Katherine Greifeld and Emily Barrett for Bloomberg may be of interest to subscribers. Here is a section:
While a December rate increase is still seen as a done-deal, Fed Chairman Jerome Powell’s comments that interest rates are “just below” the so-called neutral range changed the 2019 outlook. The spread between December 2018 and December 2019 eurodollar futures -- a measure of how much tightening traders expect next year -- is currently just 23 basis points, the equivalent of less than one Fed hike.
The 3-year to 5-year spread is not the only one nearing inversion. The gap between 2-year and 5-year Treasury yields fell to an 11-year low of 1.9 basis points on Friday as 5-year Treasuries added to their weekly gain.
To be sure, the richness of the 5-year sector on the curve has enticed sellers, who Thursday carried out a series of futures block trades betting the sector will cheapen relative to the 10- and 30-year points.

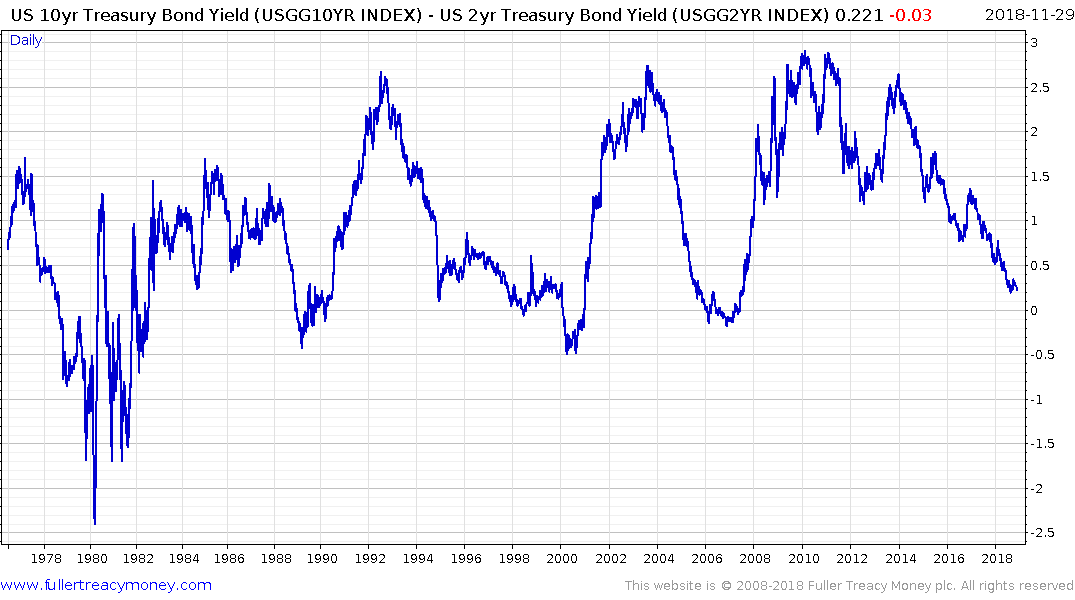
We tend to pay attention to the 10-year – 2-year spread as one of the primary arbiters of tightness in the monetary system. The basic rationale is banks make money by borrowing short-term and lending long-term. When the spread is inverted it reflects a time when that trade no longer works so banks restrict lending which tightens credit conditions in addition to the tightening which is already underway from the Fed. I can see the rationale for using a longer-dated spread like the 3-month to 30-year as Jeffrey Saut recommends, but why would anyone look at the 3 to 5-year spread?
The simple answer is traders doing butterfly spreads might look at this relationship. There is another reason though. The majority of the debt the Fed is holding has about a five-year maturity so it is the 5-year yield which is the best reflection of what the US government is paying to borrow.
.png)
The 5-year yield is currently unwinding its overextension relative to the trend mean as it continues to pause around 3%. Over the course of the downtrend, from the peak in 1981, rallies of approximately 3% have been relatively ‘normal’ in a downtrend whose primary consistency characteristic has been a succession of lower major rally highs. The rally off the low in 2012 has been in the order of 2.6%; so somewhat smaller than previous significant pullbacks in the course of the secular bull market. Meanwhile a sustained move below the trend mean, currently near 2.75% would be required to signal a return to demand dominance beyond the short term.
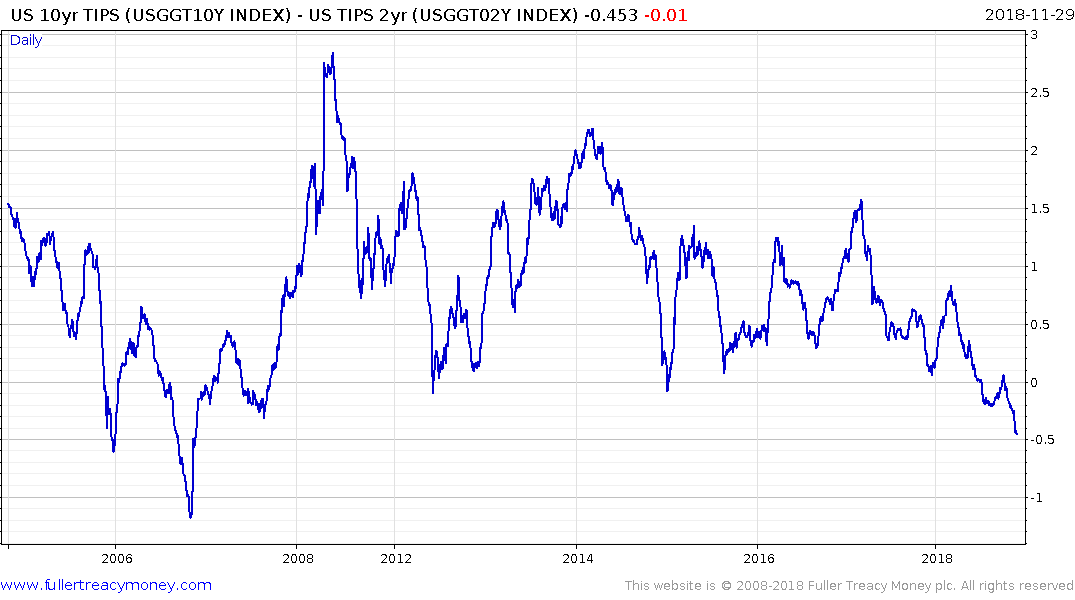
One spread that did draw my attention today is the inversion on the TIPS curve. There is no new issuance of TIPS planned so excess supply is not a feature of this market. The inversion suggests the pricing of inflation protection is out of whack and suggests investors are less than convinced of an inflationary outcome beyond the short term. We don't have the same back history for this spread but it inverted more than two years before the last recession.