
Number of shares trading above their 200-day MAs

This indicator is one useful picture of investor activity. The 200-day MA is the rough average of what the price has been over the preceding year. If a share is trading above it, the logical conclusion is that the on average prices are rising.
At the low in March, the measure approached the lows seen in 2008/09 and then it rebounded very emphatically. In March there were some very acute oversold conditions because many shares experienced exaggerated declines. As prices recovered, the overextensions relative to the trend mean narrowed and successively more have been able to rally back above them.
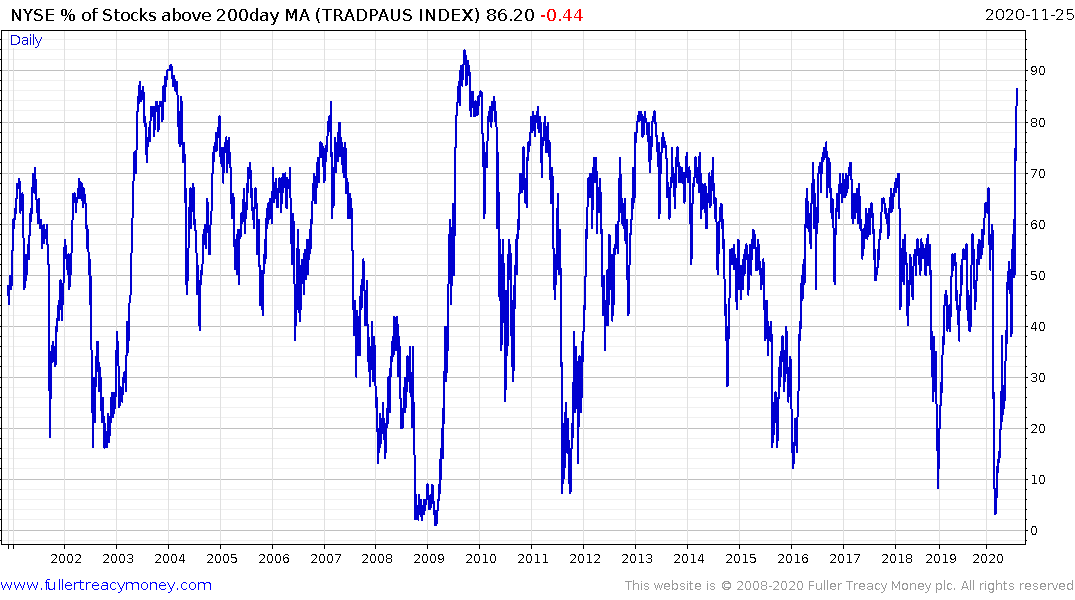
The chart is choppy because it is quite normal to see a sharp rebound follow a big decline. It’s relevant at present because the Index is closing in on the peaks from 2004 and 2009. Both of those occasions represented the end of major bear markets.
The peak in the Index generally coincides with greater dispersion in returns entering the market. The winners keep on advancing but the losers which benefitted from short covering roll over and experience a much slower pace of recovery.
Even though the measure posted significant peaks in both 2004 and 2009, they represented the bigging on new big bull markets rather than the ends. Leaders tend to lead for a reason and the shares and sectors that hold breakouts over the coming couple of months will be among the best candidates to lead in the unfolding bull market reflation trend.
The fact that commodities, emerging markets, small caps, mid-caps and energy are exhibiting relative strength at present continues to suggests the reflation theme will be the animating factor behind returns in 2021.
Back to top