
Morning Tack November 29th 2018
Thanks to a subscriber for this report from Raymond James which may be of interest. Here is a section:

Here is a link to the full report and here is a section from it:
A second consideration, however, will be this weekend’s meeting between President Trump and China’s President Xi on the trade tiff. Moreover, as our chief economist, Scott Brown Ph.D., dissected Powell’s statement:
Note that the key phrase here is “Interest rates are still low by historical standards, and they remain just below the broad range of estimates of the level that would be neutral for the economy.” The financial press is reporting that “Powell said that the federal funds rate is just below neutral” – that’s not what he said. Consider the September 26 dot plot [see chart]. The range of estimates of the long-run neutral rate was 2.50-3.50%, with the central tendency (which excludes the three highest and three lowest estimates) at 2.75-3.00% and a median estimate of 3.00%. So, while the current rate, 2.00-2.25%, is “just below” the “broad range” (2.50-3.50%), it is 75 basis points below what most officials would characterize as “neutral” – that is, implying three more 25-bp rate hikes to get to neutral. Moreover, the September dots show that most officials expect that the federal funds rate will need to move above a neutral level in 2019 and 2020 (Caveat: the “neutral” rate can vary over time and the dots are likely to shift a little in the Fed’s December 19 Summary of Economic Projections).
And then there was this from Leon Tuey:
Have a gander at the various market indices and their Advance-Decline Lines (which are more accurate reflection of “the market” than any market index). Even to a non-chartist, one can see “the market” has been behaving far better than the various market indices indicate. For example, the Dow Jones Industrial Average, the S&P 500, and the NDX reached new reaction lows in later November, but their respective Advance-Decline Lines bottomed in late October. By late November, these Advance-Declines were significantly above their October lows. Being unweighted and because the way it’s constructed, the Advance-Decline Line tells investors about the real health of the market than any market index. The positive divergences shown by the various Advance-Decline Lines show that the broad list of stocks have been acting far better than most think
How neutral is neutral is the question Fed watchers are asking this morning. If the ephemeral neutral level is between 2.75% and 3.5% then the middle of the band is over 3% but the lower end of the band is not far from where the rate is set right now and will be even closer after the December hike. That leaves the Fed with the scope to declare “job done” or not as circumstances dictate.
I am reminded of the Presidential Cycle. Historically, the Fed cleans the Augean Stables in the first couple of years of a new administration before easing up in the latter two years because the tightening tends to have a deleterious effect on growth and some stimulus is required to reignite demand. It is normal to see a pullback in the first part of the third year followed by an impressive rebound and solid 4th year performance.
The 2008 crash was a clear example of when the Presidential cycle failed but it held up reasonably well before and after that climactic selling event. With so much bearishness around and the potential for a further rebound gaining adherents, if the Presidential cycle is to be credible, we can expect additional volatility over the next six months before the bulls regain demand dominance.
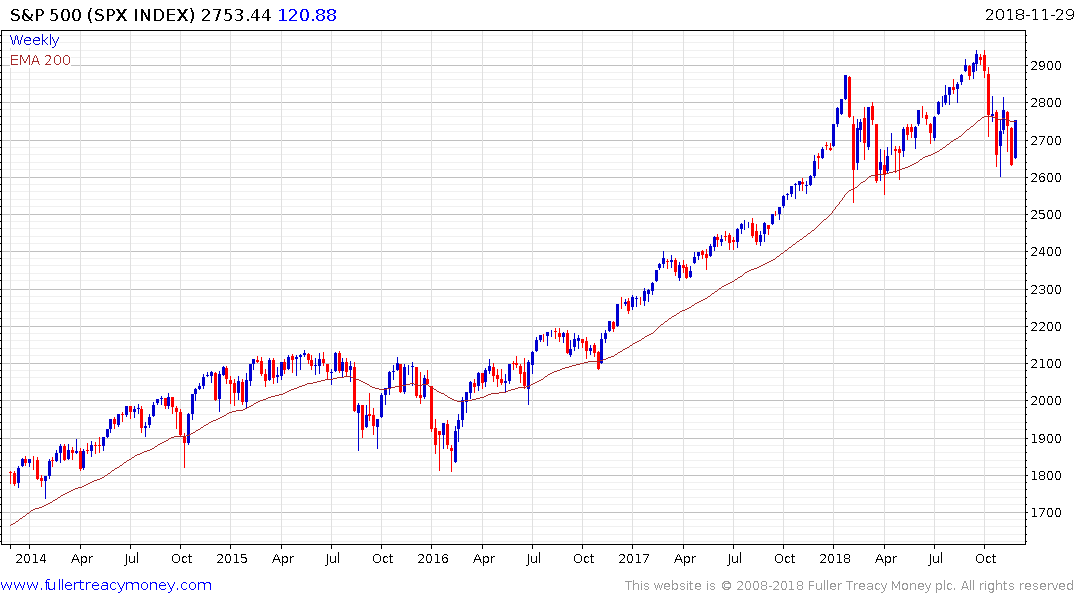
With so many reports coming out recently predicting ranging next year, I think it is safe to conclude that the one thing we are not going to see by the end of 2019 is that the market spent the whole year ranging.