
Metal Matters
Thanks to a subscriber for this report from Scotiabank which may be of interest. Here is a section:

Here is a link to the full report.
Here is a section:
Funds turn buyers again on Comex
The net long fund position (NLFP) has up until recently been declining, but this has mainly been a result of stale long liquidation, as seen by the drop in the black line in the chart above. But, while the longs have cut exposure (until recently); shorts have not been getting bearish, as seen by the declining red line. This has suggested longs have grown impatient as Gold prices have failed to break higher, but lack of upside has not encouraged bears to increase exposure. More recently, fund longs have started to increase exposure again. The gross long fund position has climbed to 259,032 contracts as of 27th March, from a recent low of 223,882 contracts. The NLFP has returned to 203,354 contracts from a low of 148,731 contracts on 20th March. This latest change was driven by 35,150 contracts of fresh buying and 19,473 contracts of short-covering.
Investors increase exposure to ETFs
Holdings in Gold ETFs are edging higher with investors adding 18.5 tonnes in March. Holdings now stand at 2,162 tonnes, up some 39 tonnes so far this year. Holdings averaged 2,068 tonnes in 2017. Given the lukewarm investor interest in Gold ETFs, it may be that the market is waiting for prices to break higher above the $1,366-$1,388/oz resistance area before increasing exposure.
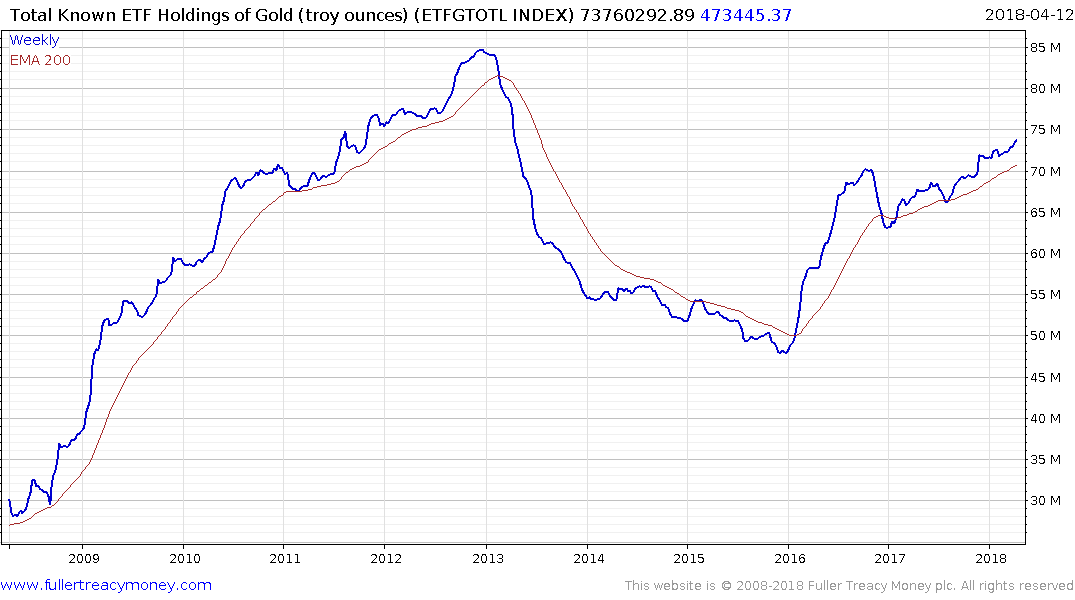
ETF Holdings of Gold have shown surprising resolve over the last 18 months. The fact that all those long positions, opened when gold rallied to break its downtrend in 2016, hung around until now, and are adding to the total outstanding long position, is a testament to the bullish interest in the metal. Considering how volatile the price has been over the same period this is a particularly noteworthy development.
I am accustomed to being the only bull in the room. That was a comforting condition to be in when the stock market was just getting off its knees, when no one was bullish. When I finished writing Crowd Money back in 2012 (it was published in 2013) it was an easy call to predict that a large number of long-term ranges were going to be resolved on the upside. I have to admit that I now feel uncomfortable with the pervasiveness of the bullish sentiment on stock markets, because it is no longer a minority view. This really is when monitoring the consistency of trends and being diligent with stops is most important.
Counter wise, I am presently encouraged by how cautious some of the most ordinarily bullish commentators are on gold. The simple fact is that it has put in a five-year base formation and when it breaks out it is likely to rally faster and further than we have been conditioned to expect by the ranging phase. The chart pattern evident since 2016 is a textbook example of a Type-2 bottom with righthand extension as taught at The Chart Seminar.
.png)
The maxim we developed during the commodity bull market was “don’t pay up for commodities”. They are characteristically volatile and prone to false breaks. That means the best time to initiate long positions is when they pull back. Gold has pulled back from the $1360 area again and a sustained move above that level will be required to confirm a return to demand dominance. The medium-term outlook remains skewed towards a successful breakout. A sustained move below $1300 would be required to begin to question that view.
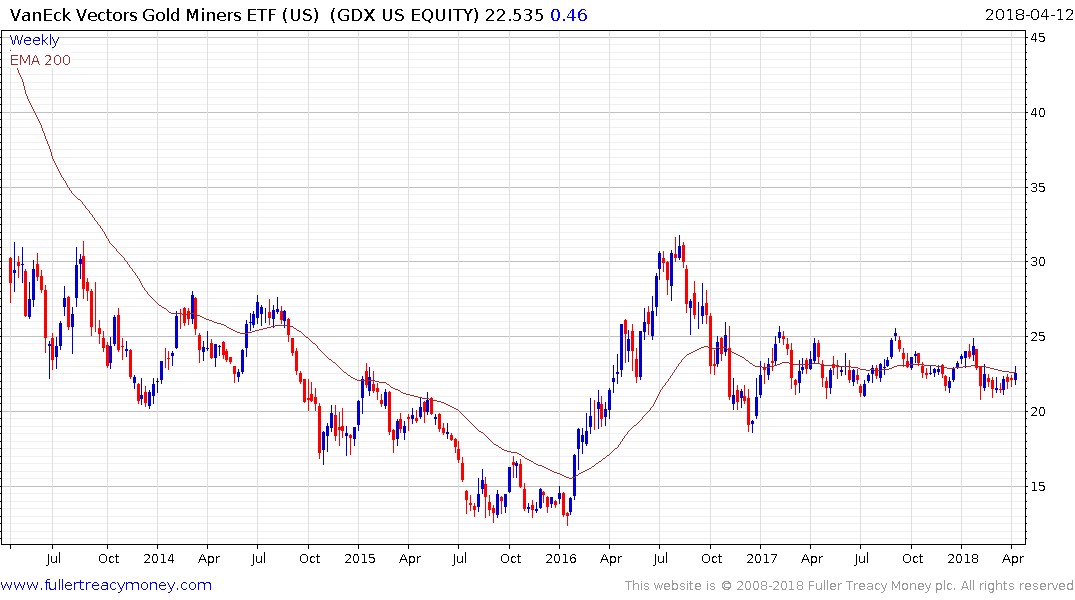
The Gold Miners ETF has been ranging mostly between $21 and $25 since late 2016. It is currently near $22.60. That might be a 20% range but it is inert relative to what is normal for the sector historically. If/when gold breaks out, the gold miners sector is in a position to offer a high beta play on the price.
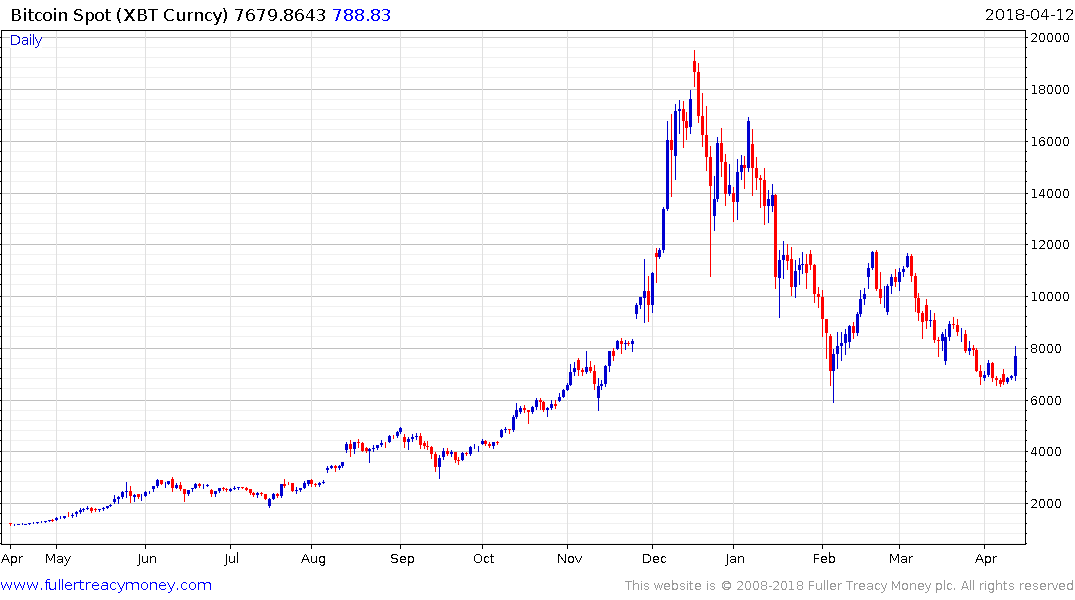
It’s also worth highlighting that my inbox has been inundated with reports proclaiming that the bitcoin bubble has burst. The time for bubble prognostications was back in December, there isn’t much value added in pointing out a bubble after a 70% decline. In fact, that suggests a lot of the froth has come out of the market and the price has just put in a higher reaction low.