
Mapping the World's Prices 2016
Thanks to a subscriber for this report from Deutsche Bank which may be of interest. Here is a section:
world. Zurich leads the way, followed by Sydney, London, Milan, Stockholm, Copenhagen, NYC, San Francisco, Amsterdam and Madrid. Tokyo is amongst the most expensive cities on most measures but surprisingly cheap hotel rooms (more akin to EM prices) help push it below many others. Our cheap date index sees Zurich, Copenhagen, Tokyo, Stockholm and Amsterdam as the most expensive cities to woo a partner. One might choose to settle down at a younger age in these countries or risk expensive courtships. London has dropped 2 places this year and out of the top 5. At the other end of the scale, cities in Malaysia, India and South Africa are the cheapest for a weekend away and around a third of the cost of the most expensive places. For those wanting a real cheap ‘cheap date’, India, Indonesia, the Philippines and South Africa are the places to go. Indeed in all of these places you can have at least 4 dates for the price of one in Zurich but please don’t tell the other 3 people!
Don’t lose your phone while away in Brazil, India, Sweden, Denmark or Italy as a new iPhone is most expensive there. The US remains the place to buy a new one, followed by HK and Japan. Interestingly there are signs that perhaps Uber is making its mark on the world as taxi prices in many places are falling sharply. Indeed in San Francisco (where Silicon Valley resides), taxi prices have fallen more than anywhere in the DM world over the last 12 months (-30%).
Bad habits cost you most in Melbourne, Singapore, Auckland, NYC and London as our ‘sin index’ of cigarettes and beers suggests. Singapore and Copenhagen really don't want you to own new cars as prices are nearly 4 times and 2 times the cost of NYC here. Buying a new car in India is half the price of NYC if you can find a way of driving it home. In addition to the aforementioned items this report also looks at the cost of various goods and services across the world. The index page provides the full list.

Here is a link to the full report.
Scrolling through the constituents of this index, the same group of countries crop up at the top and bottom of the most and least expensive. Part of the reason for this is because of relative states of economic development but the declines in many emerging market currencies is another consideration and helps to highlight how much competitiveness can be gained from a prolonged period of currency devaluation.
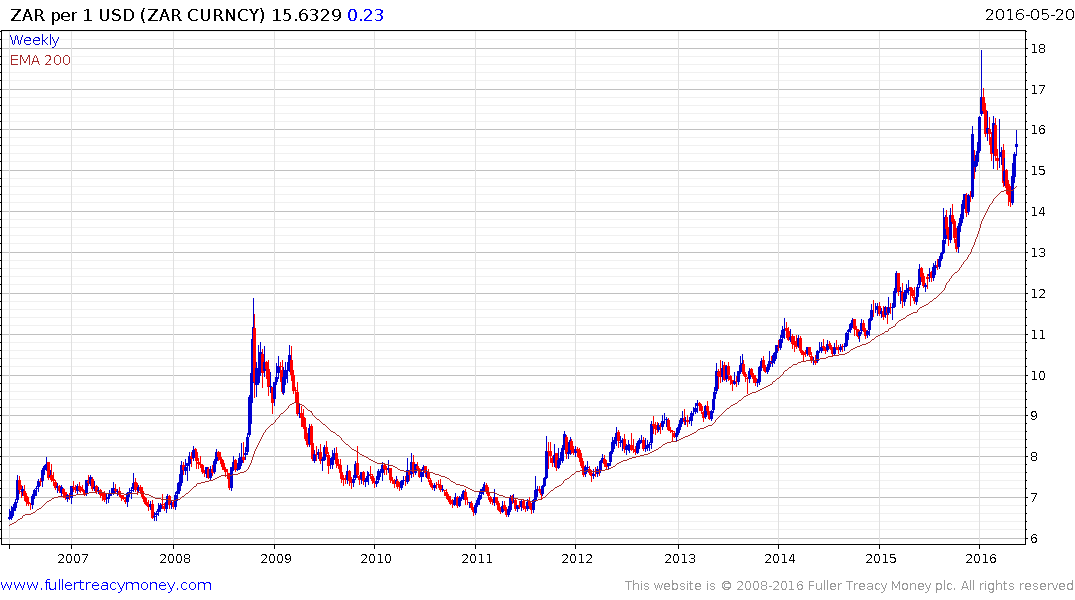
South Africa has taken a step back in its standards of governance and this is more than evident in the weakness of the Rand. The nominal value of the stock market has been supported by currency weakness while the globally oriented business such as British American Tobacco and SAB Miller are its largest constituents occupying a combined 26% of the Index. The competitiveness being garnered by the South African economy as a result of its currency weakness will come to naught until governance is seen to improve.
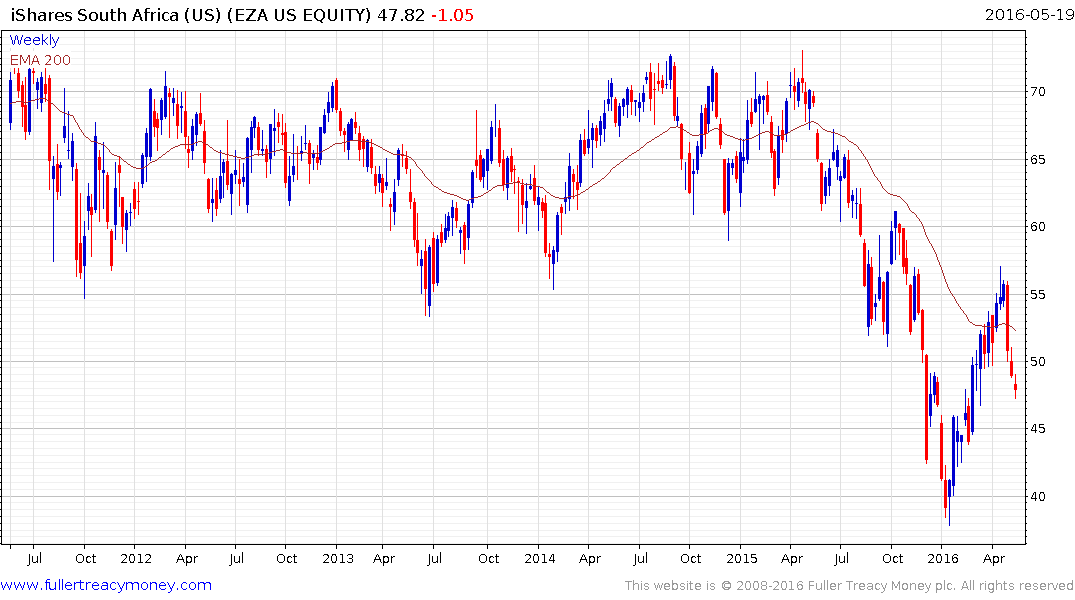
The iShares South Africa ETF encountered resistance in the region of the lower side of the overhead top formation from late April and pulled back sharply. It found at least near-term support today, following some easing in the Dollar’s rebound, but will need to sustain a move above $55 to confirm a return to demand dominance.
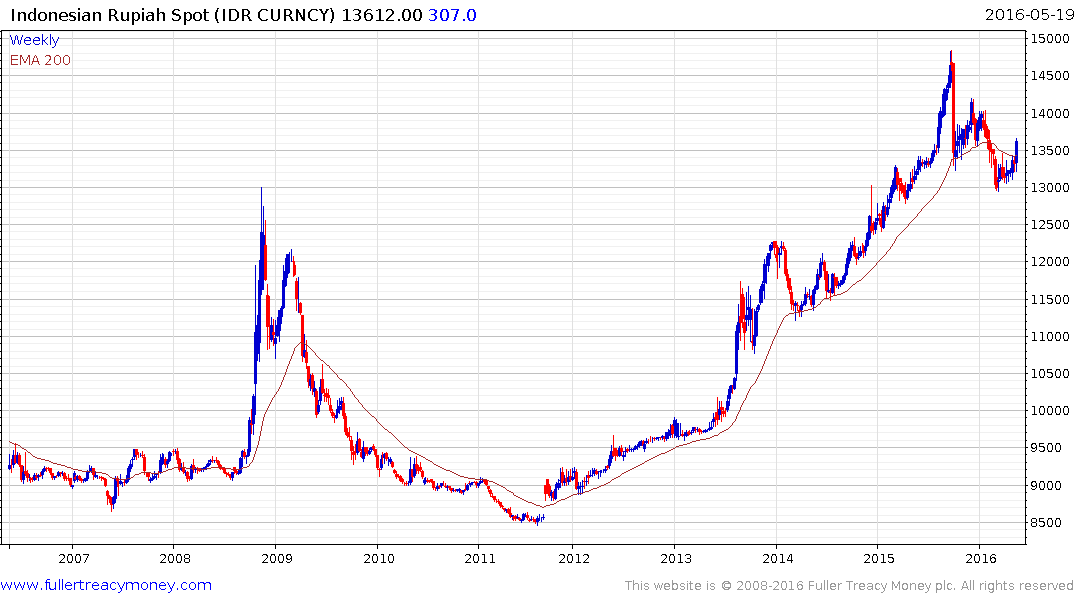
Indonesia does not have a governance deficit and in fact much needed infrastructure spending is picking up. The Rupiah accelerated to its September low and following intervention to support the currency rallied to close its overextension relative to the trend mean. A sustained move below the 200-day MA would signal a return to medium-term demand dominance but the more likely scenario is for prolonged ranging.
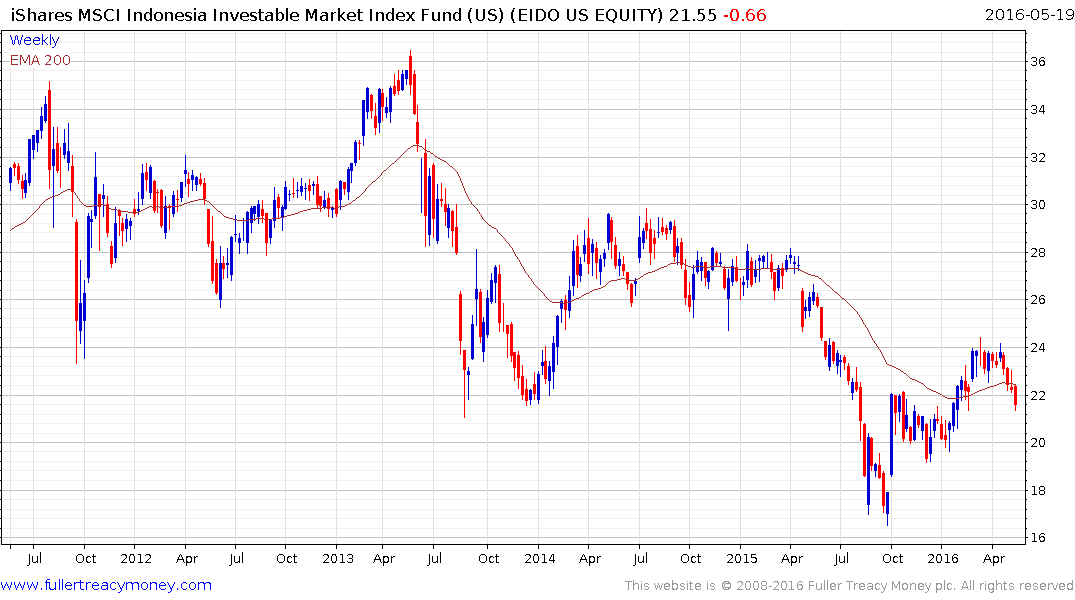
The iShares MSCI Indonesia ETF halved between 2013 and the October 2015 low. It staged an impressive rally over the last six months and has so far held a progression of higher reaction lows. The current pullback will need to hold the $20 if potential for continued higher to lateral ranging is to be given the benefit of the doubt.
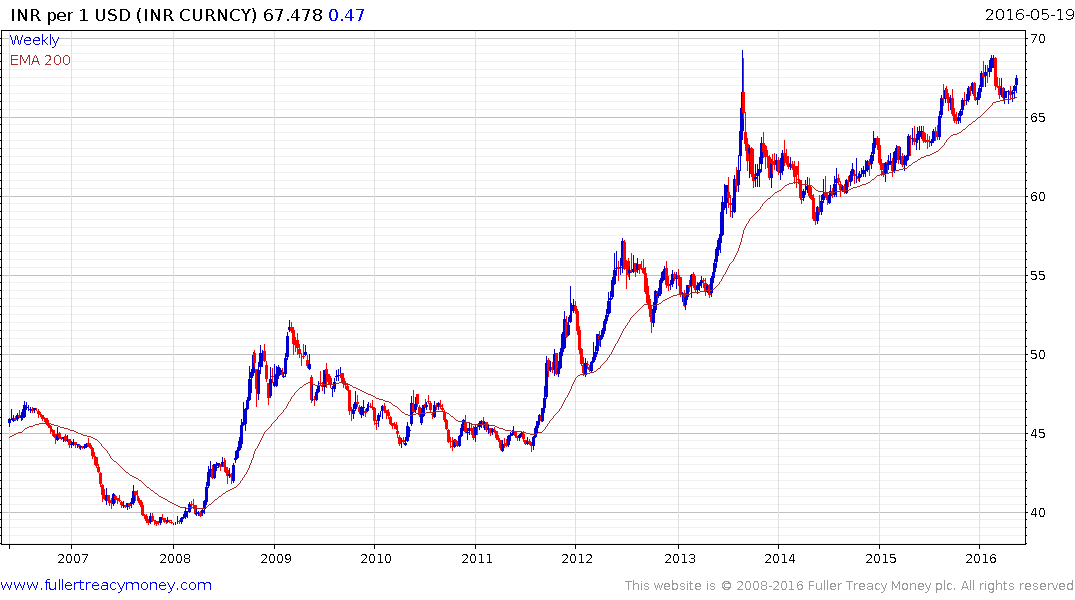
The Indian Rupee has pulled back from the region of the trend mean over the last month and remains in what is still a reasonably consistent downtrend against the Dollar. The central bank has been implementing a policy of reserve accumulation which weighs on the currency but has also successfully tamed inflation. Debate about whether Rajan should be reinstated for another terms as RBI head has begun and his renewal would be a positive outcome from the market’s perspective.
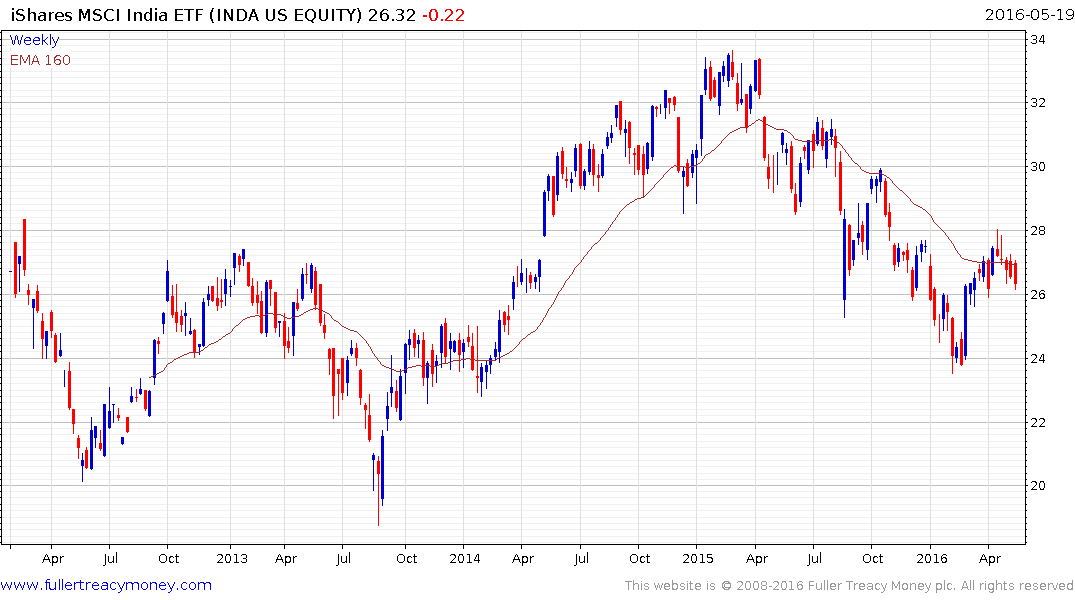
The iShares MSCI India ETF has at least paused in the region of the trend mean and will need to sustain a move above $28 to signal a return to demand dominance beyond the short term.