
Long-term themes review October 29th 2018

FullerTreacyMoney has a very varied group of people as subscribers. Some of you like to receive our views in written form, while others prefer the first-person experience of listening to the audio or watching daily videos.
The Big Picture Long-Term video, posted every Friday, is aimed squarely at anyone who does not have the time to read the daily commentary but wishes to gain some perspective on what we think the long-term outlook holds. However, I think it is also important to have a clear written record for where we lie in terms of the long-term themes we have identified, particularly as short-term market machinations influence perceptions.
Let me first set up the background; I believe we are in a secular bull market that will not peak for at least another decade and potentially twice that. However, it also worth considering that secular bull markets are occasionally punctuated by recessions and medium-term corrections which generally represent buying opportunities.
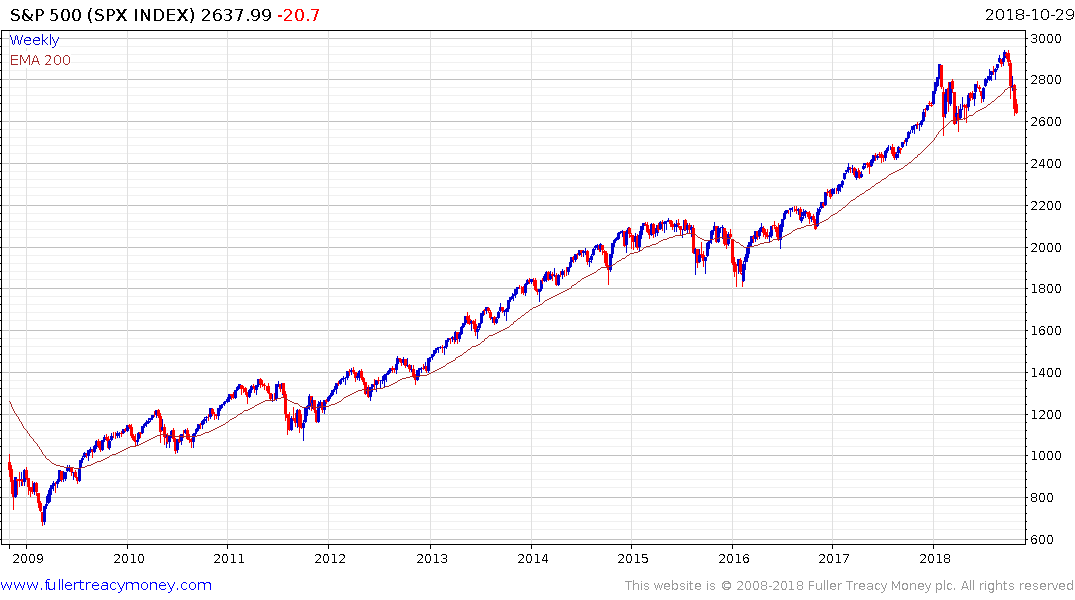
2018 has represented a loss of uptrend consistency for the S&P500 following a particularly impressive and persistent advance in 2016 and 2017. Many people are therefore asking whether this is a medium-term correction or a top. There is perhaps no more important question so let’s just focus on that for the moment.
At The Chart Seminar, we begin by saying that there are really only two big topics in markets. There is the crowd and then there are money flows.
The crowd is best monitored in the consistency of trends as sentiment ebbs and flows in a rhythmic fashion. Money flow on the other hand is about central banks and their proclivities.
The period from 2008 onwards has been characterised by one of the greatest monetary experiments in history and no one knows what the eventual outcome will be. We have characterised the advance over the last decade as liquidity driven. Therefore, it is reasonable to conclude that we need to monitor liquidity if we are to have clue to the health or otherwise of the uptrends in asset prices.
I’ve been giving talks all over the world for the last decade and I’ve always said that the total assets on central bank balance sheets and the total return on Treasury bonds are the most important charts in the world.
Central bank assets have contracted by $1.2 trillion since March and Treasury yields are holding their breakout. Without getting too complicated that is a big change we have just witnessed this year.
The Federal Reserve is now reducing the size of its balance sheet. The ECB has ended its purchase program. Japan is buying fewer bonds. However, China is now beginning to stimulate its economy by first cutting payroll taxes and supporting the banking sector.
Concurrently, the USA is engaged in fiscal stimulus and that potentially represents a major transition for the global liquidity environment if it marks the beginning of a trend. The Eurozone is seeing populism create demand for fiscal stimulus and there is scope for that movement to gain greater traction. China is also beginning to talk about fiscal stimulus.
Therefore, the big question from a global liquidity perspective is when and to what extent the world will follow the USA’s lead and transition to fiscal stimulus instead of monetary stimulus? If that happens then the liquidity fuel for continued upside will be well in place.
Interest rates are rising in response to the potential for the global economy to transition from synchronized monetary expansion to fiscally driven economic expansion. The introduction of deficit spending, dressed up as fiscal stimulus, in the USA, coupled with the rising threat from a trade war with China represent potentially inflationary catalysts.
With the Federal Reserve buying fewer bonds and the Treasury issuing more of them, it is logical that yields will rise further over the medium-term.
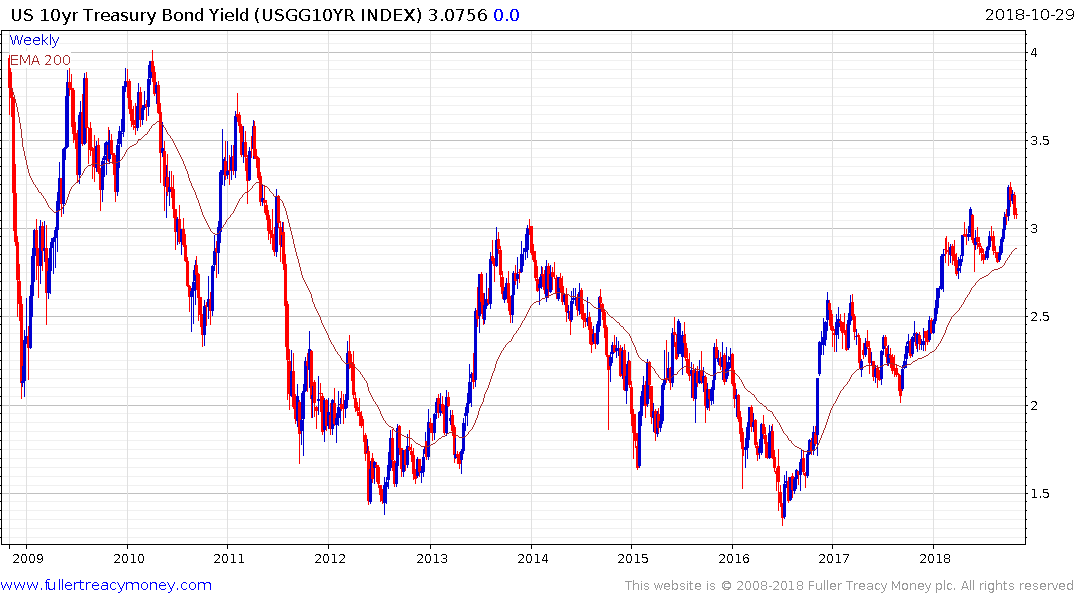
Treasury yields have been in a base formation since 2013 and arguably since 2011. The 10-year Treasury yield broke upwards to new recovery highs in an emphatic manner in early October and a sustained move below 3% would now be required to question medium-term scope for continued upside. The epic scale of both new issuance and refinancing both represent significant headwinds to sustained rallies in bond prices.
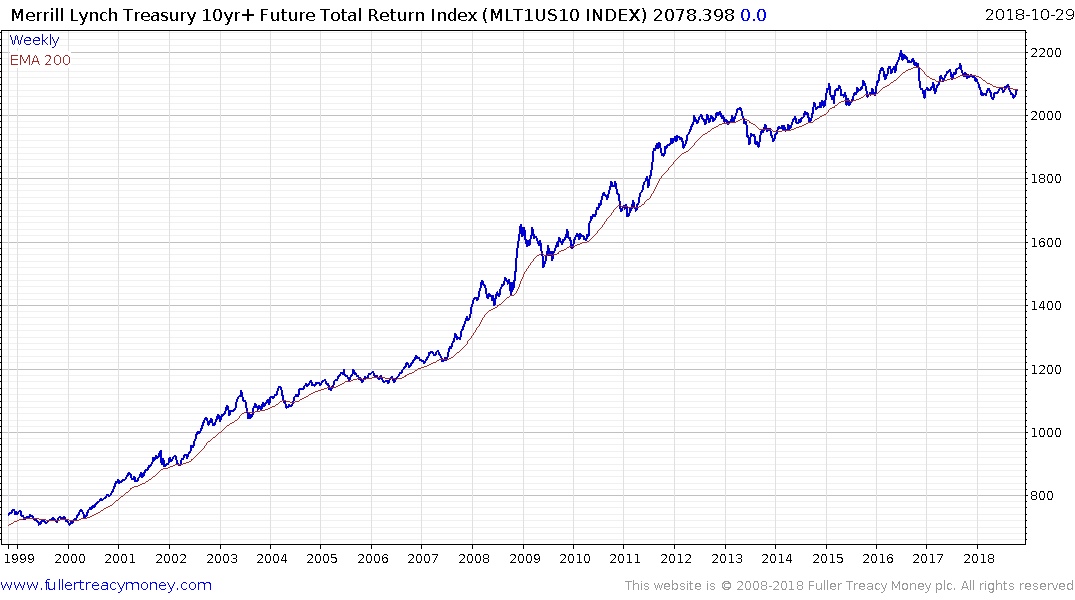
The Merrill Lynch 10-yr+ Treasury Total Return Index has completing long-term Type-3 top formation characteristics. Bonds of highly indebted countries look like particularly bad long-term investments as a result.
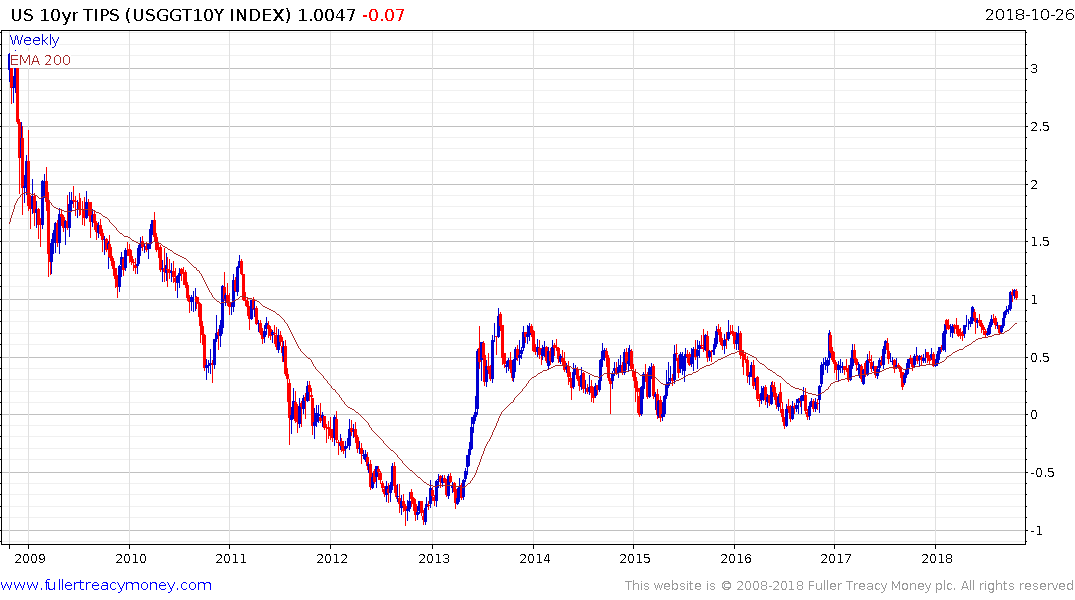
10-year TIPS yields broke successfully above the psychological 1% level in early October. Potential for additional yield expansion can be given the benefit of the doubt in the absence of clear and sustained move below the trend mean. If the Treasury market is being influenced by additional supply, the breakout in TIPS yields is animated by inflation fears since there is no additional new supply planned.
Ranges are explosions waiting to happen. With such commonality in the sovereign bonds markets the risk is skewed towards additional weakness in a sector most investors rely on for stability in their portfolios.
With tighter liquidity conditions there is increasing evidence that interest rate sensitive sectors are responding negatively.
The KBW Nasdaq Global Banks Index is comprised of all the systemically important financial institutions globally. The Index is short-term oversold but remains in a medium-term downtrend.
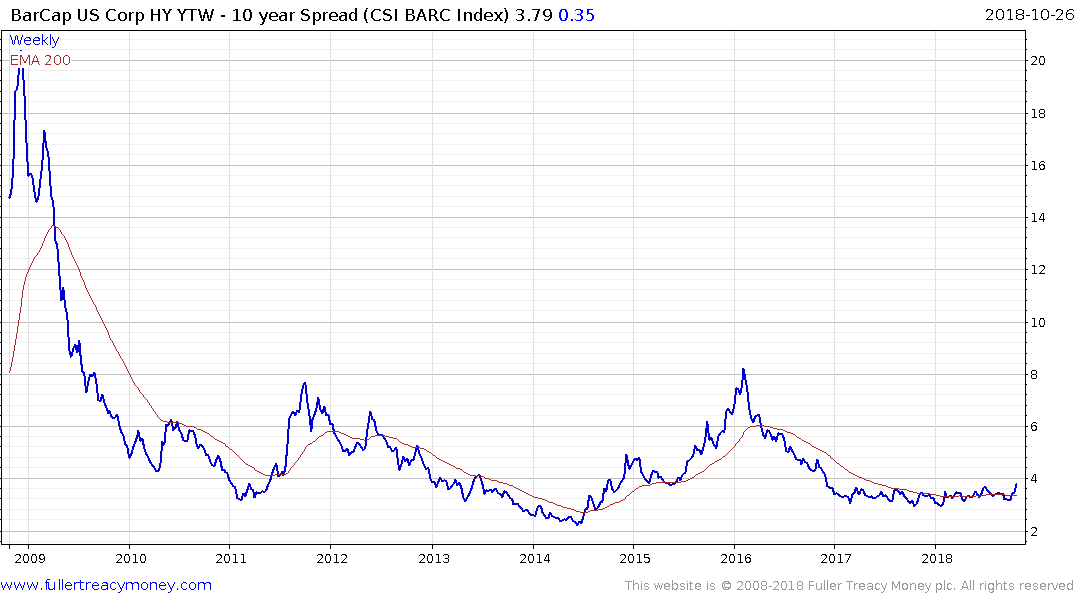
High yield spreads are also beginning to widening on a global basis which is a further sign of tightening liquidity conditions.
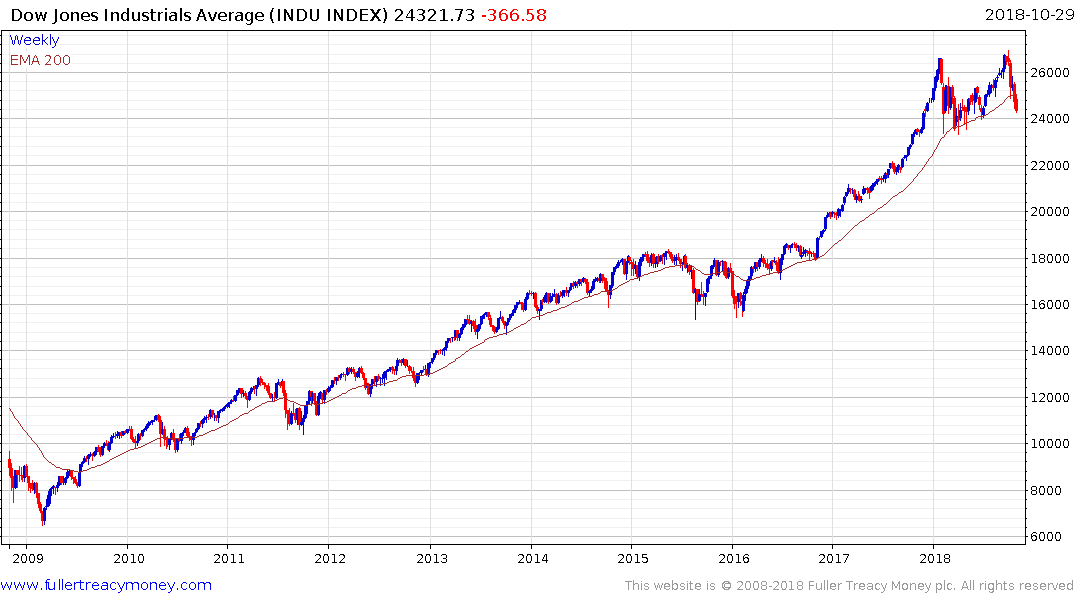
The Dow Jones Industrials Average had the clearest sign of accelerating last year and has experienced two large downward dynamics since late January and has bounced from the region of the region of the trend mean on three separate occasions. It is now retesting the region of the trend mean again, following a failed attempt to breakout to new all-time highs.
In a reasonably consistent uptrend, reversions to the mean generally represent opportunities to increase long positions so there is a logical argument for waiting until an index is in the region of the mean before buying.
Let’s spend a little time to address the consistency of the trend upward from the 2009 low. It was pretty choppy between 2009 and the end of 2012 which fits with the first psychological perception stage of disbelief. The trend then became more consistent between 2013 and the middle of 2015 which was where investors accepted the role played by central bank liquidity provision in supporting asset prices. That was the second psychological perception stage of this medium-term bull market. The medium-term correction between 2015 and late 2016, which was eventually resolved on the upside and initiated the steep advance over the up to the January 2018 peak was predicated on loose fiscal policy replacing loose monetary policy.
Quite apart from the acceleration which is a clear Type-1 trend ending, the widespread acceptance that stock picking is a waste of time and that the only way to invest is via ETFs is synonymous with the triumph of the buy-and-hold strategy. That view is characteristic of the third psychological perception stage of every bull market. On some occasions the third psychological perception stage climaxes with a bubble in one sector or another.
The kinds of companies that do particularly well when liquidity is abundant are those that go out and borrow as much as possible; betting they can get to profitability before they need to refinance at higher rates.
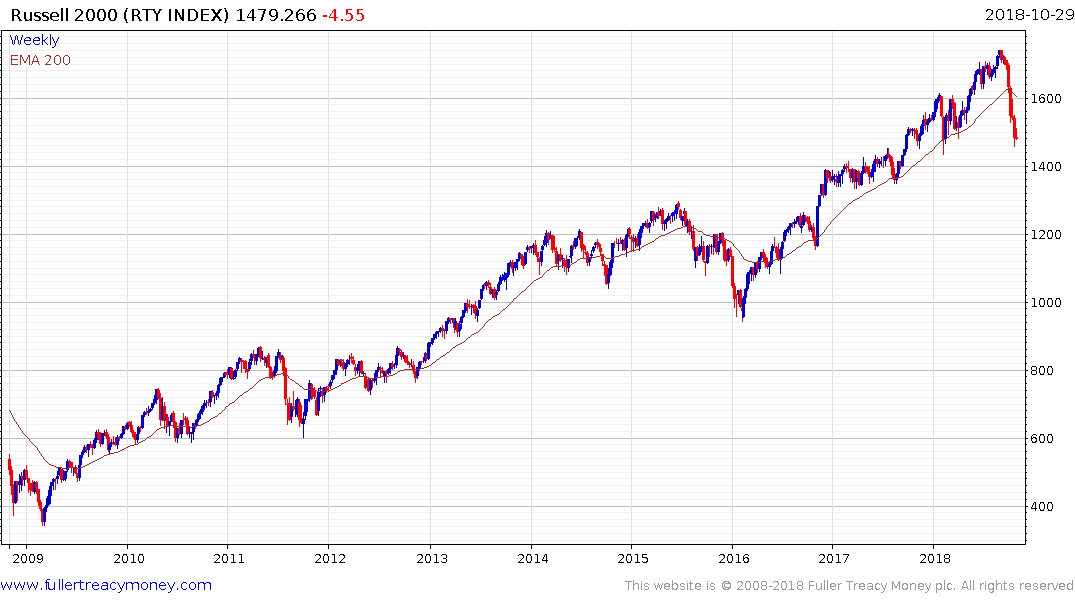
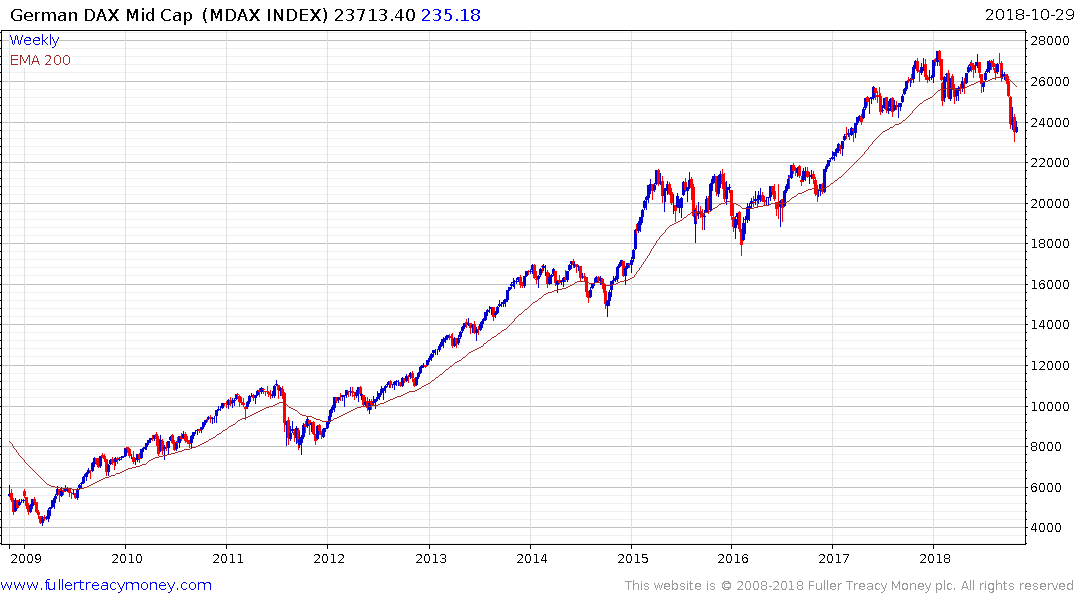
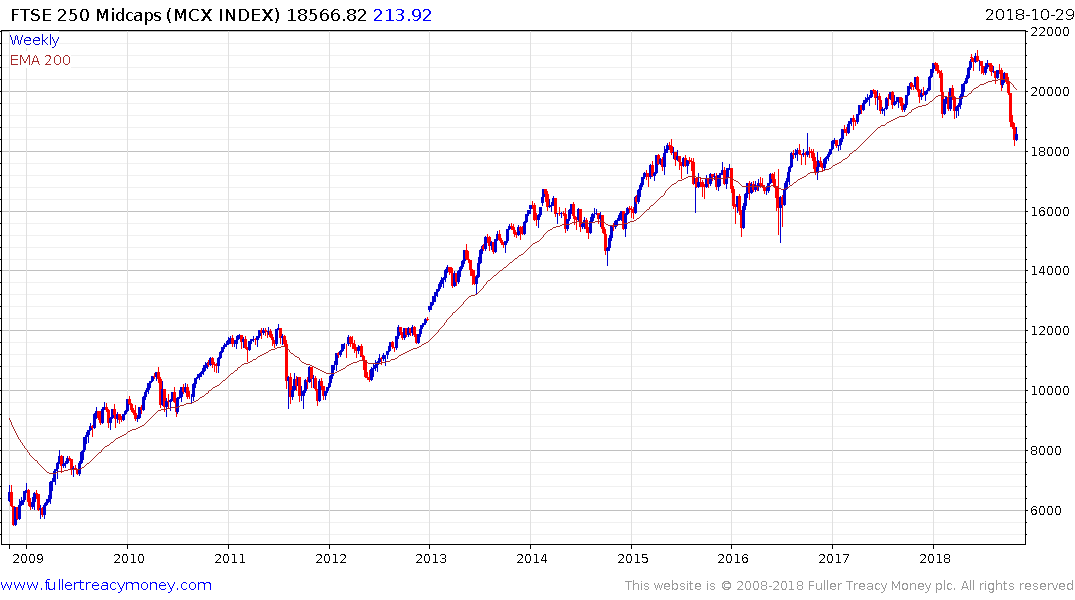
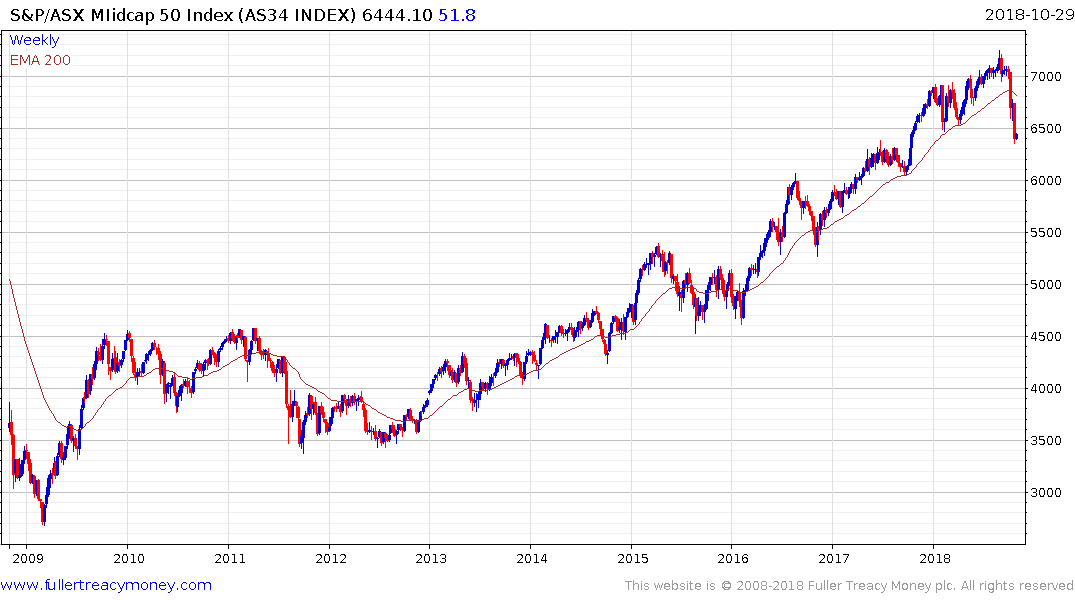
Midcap indices in the USA, Germany, UK and Australia were among the clearest leaders off the lows in 2008 and are now underperforming. Perhaps more importantly they have gone from exhibiting clear relative strength to downside leadership in the last month which is not a positive development.
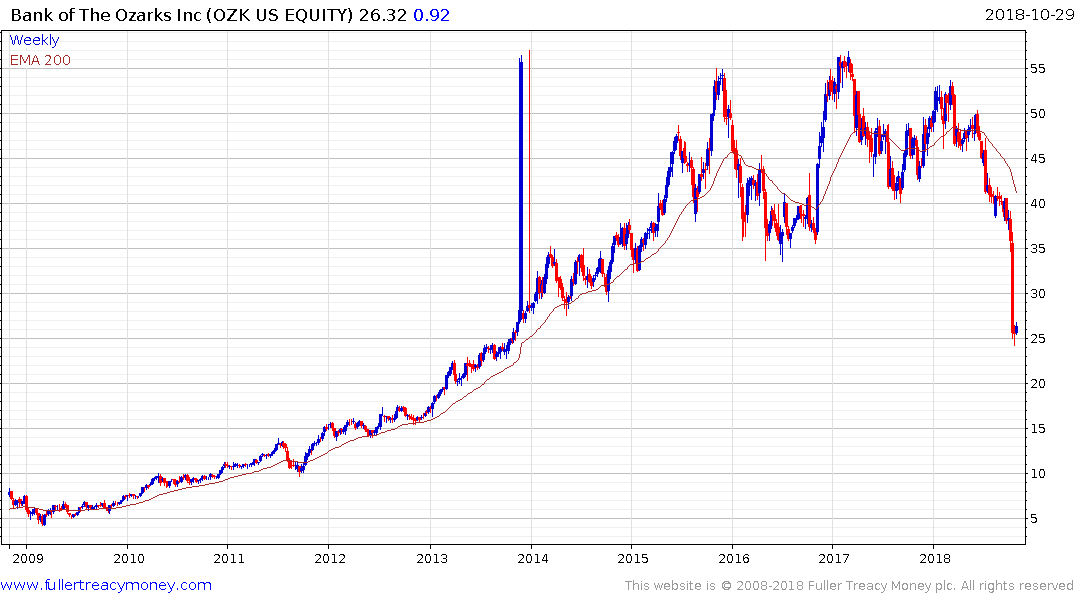
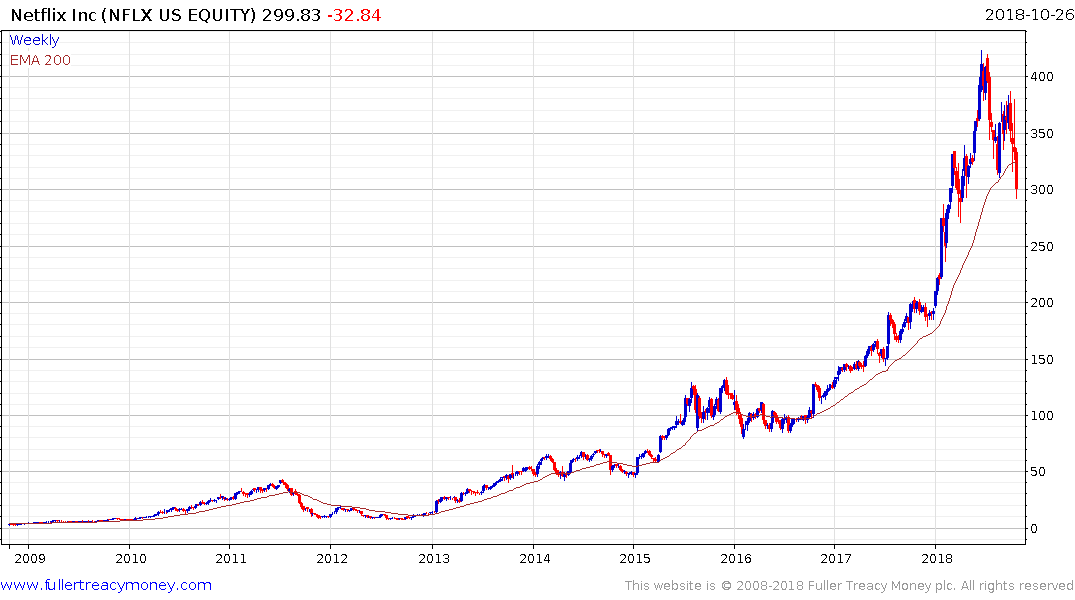
Among interest rates sensitive stocks, Bank of the Ozarks does not look like it will make it to profitability before its liabilities come due and big questions are now being asked of Netflix’s liquidity situation against a continued drive to borrow more. These are more concrete examples of what we see in the widening spreads in the broad high yield sector.
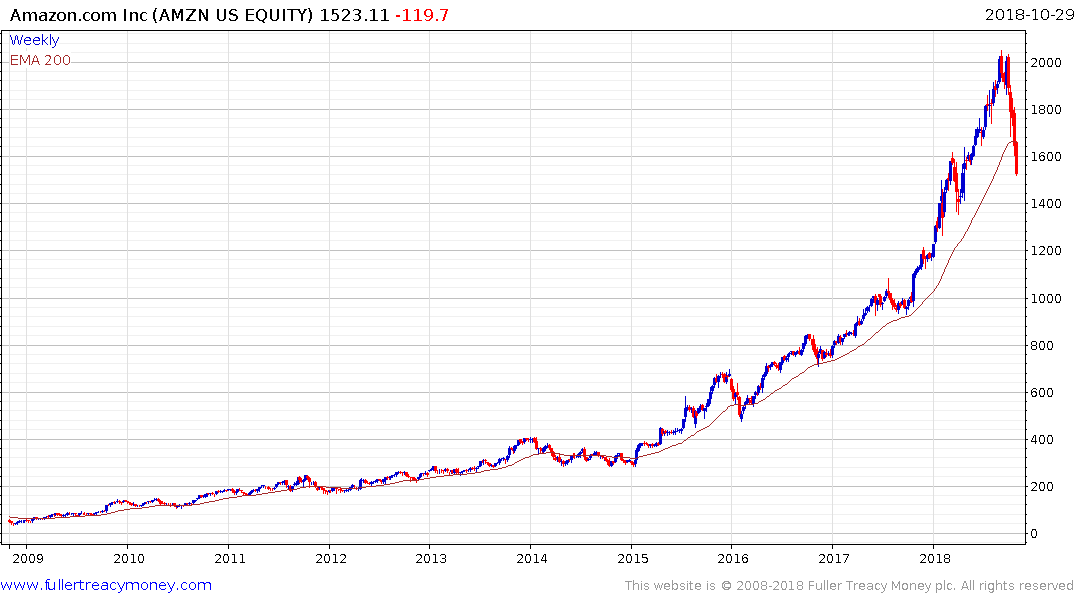
Amazon is the largest company that has been profiting on the back of investor’s tolerance of no profits in service to expansion. It is A rated so far from high yield but the share is now at a very important area of potential support.
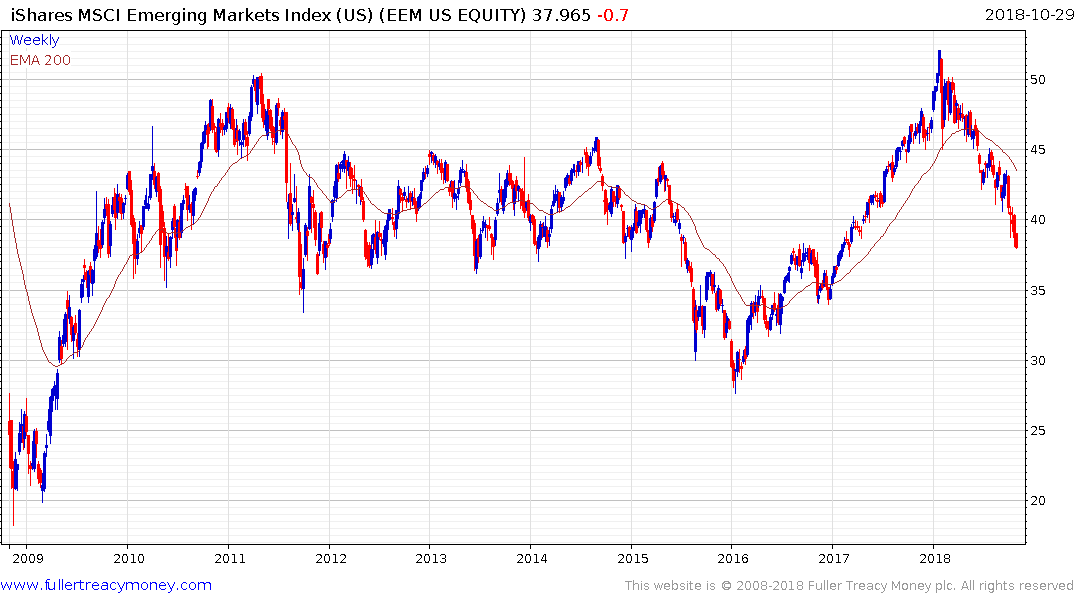
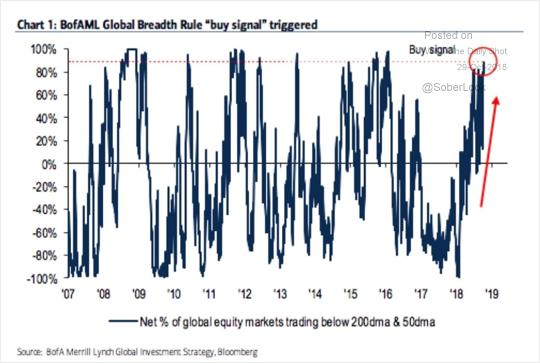
The pressure coming to bear both on Emerging Market currencies and their respective stock markets is a symptom of the wider sense of risk aversion towards instruments susceptible to higher Dollar funding costs.
.png)
Meanwhile the primary lead indicators for recession are not flashing red. The yield curve spread is still positive, unemployment is close to a record low and oil prices are not surging higher.
The last time we had conditions similar to these was between 2014 and 2016 which represented a very volatile period for markets. By the middle of 2016 bond yields hit a new all-time low and, since then, the yield has more than doubled. At the same time equities broke out and rallied rather spectacularly.
The 2-year Treasury yield is currently sitting at 2.82% while the Fed Funds rate is 2.25%. Therefore, the bond market is expecting rates to be static, on average until 2020. However, the trend says otherwise. The clearest safe haven in a falling bond environment is to capture stakes in companies that have solid cashflows and the potential for outsized dividend growth. The Bank of Switzerland and Bank of Japan have been doing just that with their equity purchases.
The relative strength of defensives, such as utilities and household products companies, is testament to the fact they are akin to floating rate bonds in a rising rate environment and attractive as less speculative investments in a time of stress.
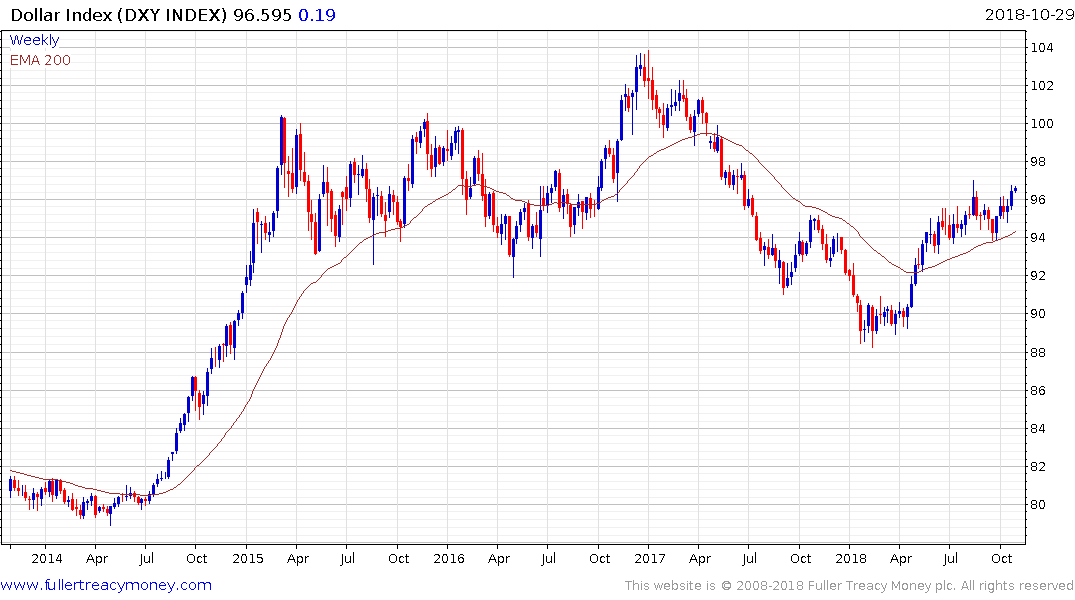
It has puzzled many people why the Dollar has been so firm over the last six months but if we start to figure in widening interest rates differentials between the 2-year yields and the relative trajectory of their various banking sectors perhaps we have a better rationale for Dollar outperformance. The relative strength of Wall Street plays a role in demand for the Dollar. Perhaps the most important point stems from an adage David quoted on many an occasion. “No country wants a strong currency but some need a weak one more than others.” Right now, China and other emerging markets, like Turkey, Argentina, Venezuela etc need weaker currencies.
Changing international alliances and altered national priorities as a result of the revolution against the status quo is having a profound effect on the finances of countries that have borrowed in a currency that is not their own. That represents the clearest challenge for countries that have not demonstrated improving standards of governance.
The above charts clearly point to at least a medium-term correction for markets but that is occurring within the context of a secular bull market.
The secular advance is being driven by the exponential pace of technological innovation. This is most especially true of what is happening in the energy and healthcare sectors. The gamechanging effects of the shale oil and gas revolution continue to be felt, with the USA now being the world’s largest producer of oil as well as being one of the most influential exporters. Innovation in battery technology, while slower than many might like, is inexorable and continues to improve. That holds out the prospect of being an equally gamechanging innovation for the global transportation sector over the course of the next decade.
The cost of genetic sequencing is falling faster than anyone ever predicted when it was first achieved and its being supplemented by CRISPR editing technology which is revolutionising cancer care. Since the rising cost of cancer care and long-term chronic conditions are major burdens for health services globally there is the prospect that innovation in healthcare will be able to moderate that spending trajectory over time and therefore enhance aggregate productivity.
The adoption of capitalism by an increasingly large proportion of the globe’s population continues to help billions of people to improve their living standards and approximate a middle-class standard of living. Half the world’s population now approximates a middle-class lifestyle and the trend of improvement remains intact. That represents a tailwind for demand for just about everything over the coming decades.
Taken together technological innovation, the revolution in the energy sector and the rise of the global consumer complement each other to drive the secular bull market theme. These are the themes likely to drive investor interest once this corrective phase has run its course but are not very fashionable right now.
Dow/Gold
The best graphic illustration we have for the long-term cyclical nature of stock market performance is the Dow/Gold ratio because we have more than 100 years of history. There has been an average of 35 years between major stock market peaks and the last major peak for the ratio was in 1999. That suggests we are about half way through this secular bull market for stocks versus hard assets like gold.
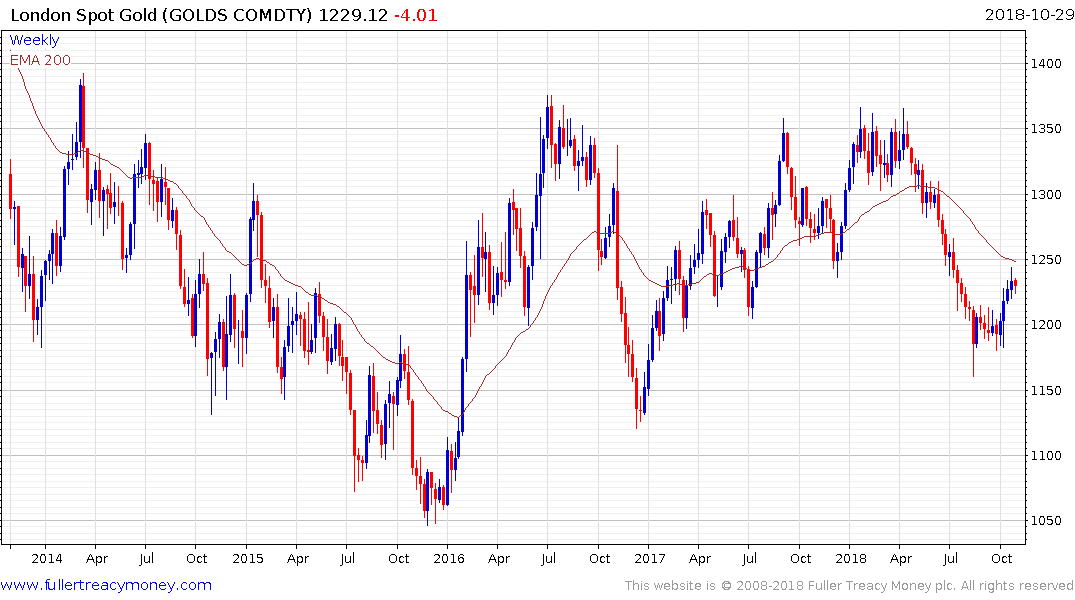
As a monetary metal, gold does best when it is appreciating against all currencies. Those occasions tend to reflect a loss of faith in the purchasing power of fiat currencies. It also tends to do well when inflation is running ahead of central bank willingness to raise interest rates. At the present time the Federal Reserve is raising interest rates without headline inflation yet surging higher so gold has been under pressure. However, the US Dollar is the strongest currency in the world right now while a significant number of other currencies remain under pressure. That means gold is somewhere in the middle of the field in terms of monetary equivalents.
Gold rallied this month to break a six-month progression of lower rally highs and the upside can be given the benefit of the doubt provided it continues to hold the low near $1160 posted in August.
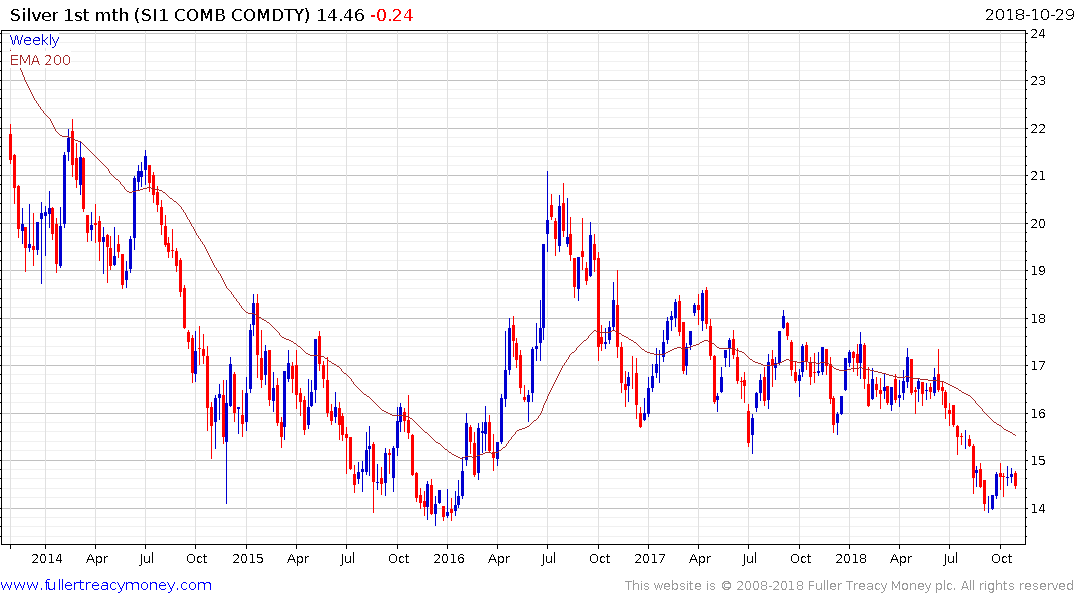
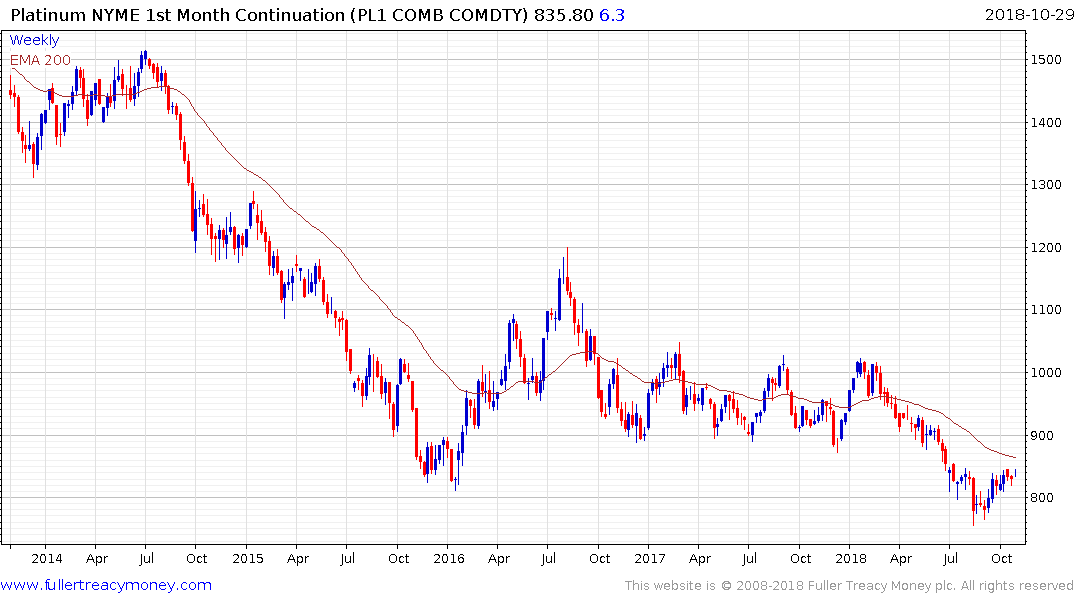
Silver and platinum prices have rallied more impressively over the last two weeks to break their respective downtrends. They potentially represent lead indicators for the gold price because as smaller markets they are more heavily influenced by weight of money coming into the market.
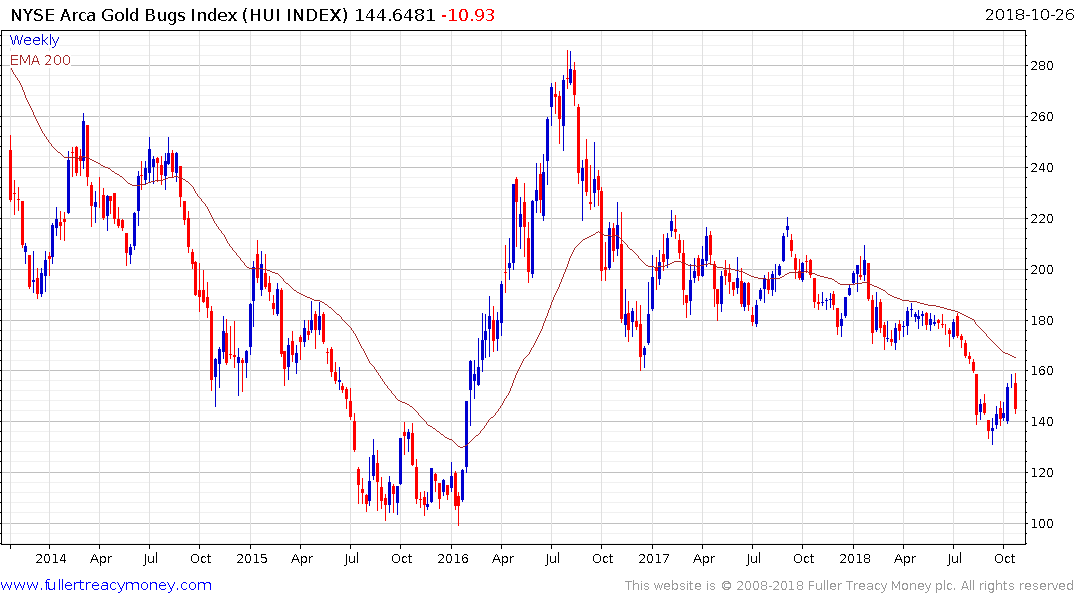
Gold shares are about the most under owned asset class at the moment considering the fact that the marginal cost of production is on average in the region of $1000. However, investor interest is tied to perceptions of the outlook for the gold price and the Index is now ranging following its accelerated decline in August.
So, what’s next? We have seen substantial deterioration in the consistency of trends in October with midcaps in particular dropping to break medium-term uptrends. That is not encouraging particularly against a background where tech leaders, which has the clearest evidence of acceleration, are now declining.
There is also clear evidence of rotation underway into real old-world defensives.
It is also worth considering that the market broke out and rallied immediately after the US Presidential election in 2016 as an unswervingly pro-business administration took office. With the US Congressional elections next week, there has certainly been some evidence of selling the rumour going on. We will see next week if there is evidence of buying the news.
Valuations are not demanding with levels today comparable to what was on offer back in 2016. That holds out the prospect of a rebound not least on a contrarian basis.
It’s also worth remembering that acceleration is trend ending on the downside too and that is increasingly evident within the emerging markets where value is rapidly returning.
An additional point is the market does not yet know at what point of market pain the Fed will be prompted to stop raising rates. The new Fed governor has not yet been tested but that may now be underway.
Governance is Everything
What about protectionism? This is a non-trivial risk. China has fostered a harem of national champions by excluding competitors, offering massive financial and regulatory incentives and engaging in an historically unprecedented policy of industrial espionage.
The Trump administration is now attempting to combat that policy with aggressive tariffs which are likely to harm the US economy as well as the Chinese one. China is attempting to take the moral high ground and is adopting the façade of being the more reasonable party, but there is no denying the role it has had in ignoring patent law for decades.
The simple fact of the matter is that China is not evolving into a free market economy; rather the opposite. It has declared itself an international competitor of the USA and is now effectively a dictatorship. China therefore requires an additional risk premium from the perspective of international investors. It would be hard to argue standards of governance are improving in the country.
It is easy to be impressed by Chinese efficiency in infrastructure development. When one visits Shanghai, Beijing, Shenzhen or any of the other tier 1 cities one could be forgiven for thinking how can China still be an emerging market? China has built a domestic digital economy through protectionism and copycatting that rivals the efficiency of the global technology mega-caps and that is an incredible achievement.
However, I heard someone say once that for every 100 kilometres you get from a tier 1 city, you go back 10 years in time. In my experience that is accurate. The vast majority of development has occurred along the coastal periphery while the inner hinterland is still underdeveloped and is likely to always stay at a relative discount to the coastal cities in much the same manner as other countries.
China’s administration is doubling down on crowd control. Everything from artificial intelligence to phone tracking and cameras are being deployed to exert a degree of control over the population unheard of in human history. The Party is reversing corporate independence so that companies are rapidly becoming organs of government control.
Shouldn’t we be asking why that is when the majority of people are willing to play along with authoritarianism? The answer as far as I am concerned is simple enough. History is replete with examples of how fragile authoritarian regimes are. They appear unshakable one year, only to disappear the next. China’s property market has been expanding for decades. The economy has been expanding for decades and debt levels are rising. No country in history has had uninterrupted growth. What will happen in China when we get that interruption? The Communist Party is fully aware of that which is why they are acting now to secure control. If one is a long-term investor the only conclusion is that China now deserves a higher risk premium than it did a year ago.
India is chaotic and crowded. With a third of China’s land mass, India has a larger population and there is a cacophony of competing objectives for the nation’s myriad ethnic minorities; each with its own language religion and traditions. India has always had a dynamic domestic economy and with English as a first or second language for most people, it has had few obstacles to engaging with the global economy. India’s sclerotic bureaucracy and deep-seated corruption, where bribes are integral to the functioning of the system tends to put people off investing and the historic volatility of the Rupee reflected the mismanagement of the economy. India does not have the infrastructure China boasts and there are significant obstacles to achieving that status.
However, let’s think about it in another way. Standards of governance are vitally important for an international investor for the simple reason that once you invest it would be nice to know that your money will still be there when you come back to get it. Minority shareholder rights are vital so that vested interests cannot overwhelm our smaller shareholdings. You need an independent judiciary if you are going to have minority shareholder rights upheld. A free press is vital if the worst temptations of power are to be contained by outing improprieties in public.
David pioneered the term Governance is Everything decades ago. If we apply these filters to India and China we are drawn to an interesting conclusion. After all China has none of these three characteristics of improving standards of governance while India has all three, so does governance mean anything? If we look at history, democracies are messy and prone to crises, but they promote a sense of people striving for a common good and are therefore inherently more stable over the long term.
One of the things many people worry about is that inequality has become a structural issue for a lot of countries. When credit is abundant and economies and wages are growing they paper over a lot of cracks in the social infrastructure. The advent of both globalization and technological innovation have been highly disinflationary, while also creating an environment where the emerging markets have flourished.
At the same time offshoring and greater competition have resulted in large numbers of disaffected workers in the rust belts of major economies. These communities, which were once the bedrock of the economy are now riven with unemployment, declining standards of living and drug abuse.
In democracies that condition is unsustainable which is giving rise to reactionary parties for people all over the world who ask “What about me?” Rather than characterise this movement as populist, xenophobic, anti-immigrant or racist I believe it is more correct to view them as symptoms of a wider revolt against the status quo. Protectionism is about as close to the polar opposite of globalization as I can imagine. It fits squarely into the revolt against the status quo I have been talking about for two years and it is also inflationary.
The answer to the question “What about me?” is “Here, have some money” That decision to embrace appeasement rather than tackle the basic structural issue is highly inflationary.
I do not believe it is a coincidence that social democracy and globalisation prospered as interest rates trended lower for decades. One of the most important results of the quantitative easing that represented the response to the credit crisis was to favour traders over savers. That contributed to the widening gap between rich and poor. The conclusion which people are now finally coming to is QE is great at inflating asset prices but fails in the trickle-down effect it aimed at achieving. Fiscal largesse provides better trickle down but also contributes to higher rates which demands better productivity and efficiency.
The largest weightings in the world’s largest stock market indices are global companies with extensive franchises so protectionism is bad news. Right now, tariffs are being imposed on China with good reason. There have been an increasing number of stories about China stealing, spying and interdicting trade secrets to favour its own domestic industry. Therefore, the companies most at risk are those with large Chinese operations as well as Chinese companies with big international franchises. A medium-term correction is generally characterized by anything from a 10% to 20% correction.
There has never been a long-term secular bull market that has not been punctuated by the occasional recession but these have generally been buying opportunities from the perspective of long-term investors.
So, the big question many people have is if we accept the bullish hypothesis how do we justify the second half of this bull market based on valuations where they are today? Technological innovation is going to get us a good part of the way and we already have plenty of evidence of that. There is an increasing body of evidence that the decline of manufacturing has more to do with globalization and offshoring than automation. In fact, there is a clear correlation between the countries that have embraced automation and vibrant manufacturing sectors. That suggests technology is the answer to productivity declines rather and the cause.
However, the answer is also going to have to include inflation. Protectionism and populist policies are inflationary. Generally speaking, the stock market reflects the inflation rate.
Commodities
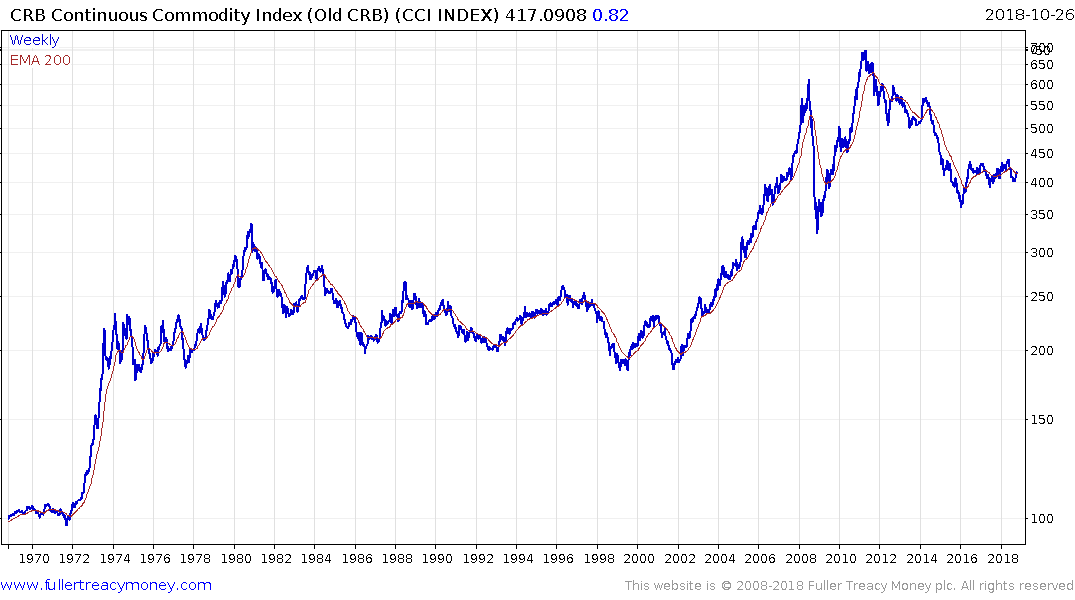
Commodity prices represented by Continuous Commodity Index is bouncing from the region of the lower side of its two-year range.
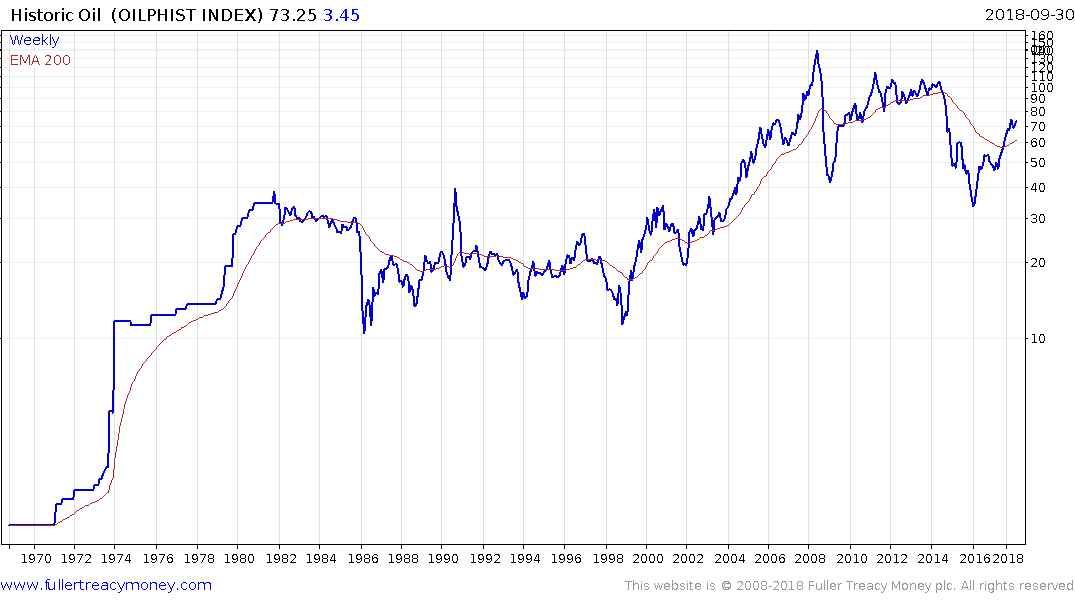
Energy prices, represented by oil, tend to move in long-term bull and bear market cycles. We’ve had an impressive bull market and now we are in another lengthy ranging phase which could last another decade. My working hypothesis at present is that $70 represents the point at which additional new supply is brought to market. Rising geopolitical tensions represent a tailwind for prices and the Brent Crude has pulled back into its underlying range and will need to rally soon if the medium-term uptrend is to be given the benefit of the doubt.
Surging oil prices have generally presaged recessions so this is an important market to monitor if prices do indeed surge higher and accelerate towards $100 irrespective of increasing supply coming to market.
Technological innovation is also working its way through the energy sector as unconventional supply moves mainstream. Concurrently battery manufacturing scale and better chemistries continue to reduce costs while governments are mandating increasing demand. For example, Tesla announced 8:1:1 chemistries (nickel: manganese: cobalt) have already been delivered in its Model 3. That represents a significant headwind for the oil sector over the medium to long-term, but it removes a headwind to growth for oil consumers.
Improving governance, capitalism and free markets have lifted billions of people in the emerging markets out of abject poverty and into the middle classes. This is contributing to productivity gains which is driving growth in the world’s major population centres. Rising protectionism will not derail that trend provided we see continued improvements in the standards of governance. The expansionary ambitions China is increasingly expressing suggest that there is a long-term risk the global economy will take on bi-polar characteristics with economic centres of gravity competing against one another.
The global population is expected to expand by an additional 2 billion people within the next 20 years and the majority of those people are going to be in Africa. Considering the evidence, we already have that technology both promotes growth and detracts from it, the only way Africa is going to emerge to the point where individual countries can reach their productive capacity is through improving governance.
With a continent the size of Western Europe and North America combined there are going to be both success stories and failures so it is important to remember that standards of governance are not an absolute. It is the trajectory that is important. We need to ask ourselves whether conditions are improving or deteriorating. Dumping Zuma was a major step forward for South Africa while Ethiopia’s single party government clamping down on protests can be viewed as a retrograde step.
Elsewhere there is ample evidence of improving standards of governance delivering on productivity growth not least in ASEAN and India which remain in secular, albeit volatile growth trajectories.
Investment vehicles
Generally speaking it is in the latter stages of a cyclical bull market that cyclical sectors outperform. Mining, energy, banking and biotechnology all fall into that category because they are all leveraged to global growth and access to liquidity. However, the pressure that is coming to bear both on Chinese markets and its economy have had a wide- ranging effect on the commodity markets, particularly industrial resources, which has contributed to their underperformance over the last few months.
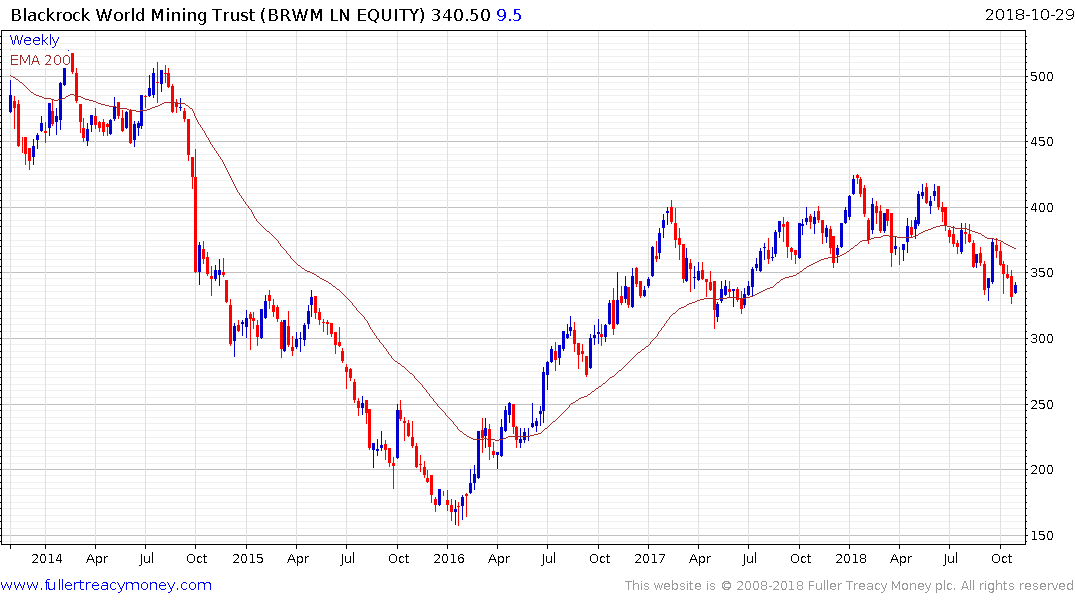
The BlackRock World Mining Trust is trading at a discount to NAV of 11.76%. It encountered resistance in the region of the trend mean in September and will need to sustain a move back above it to signal a return to demand dominance.
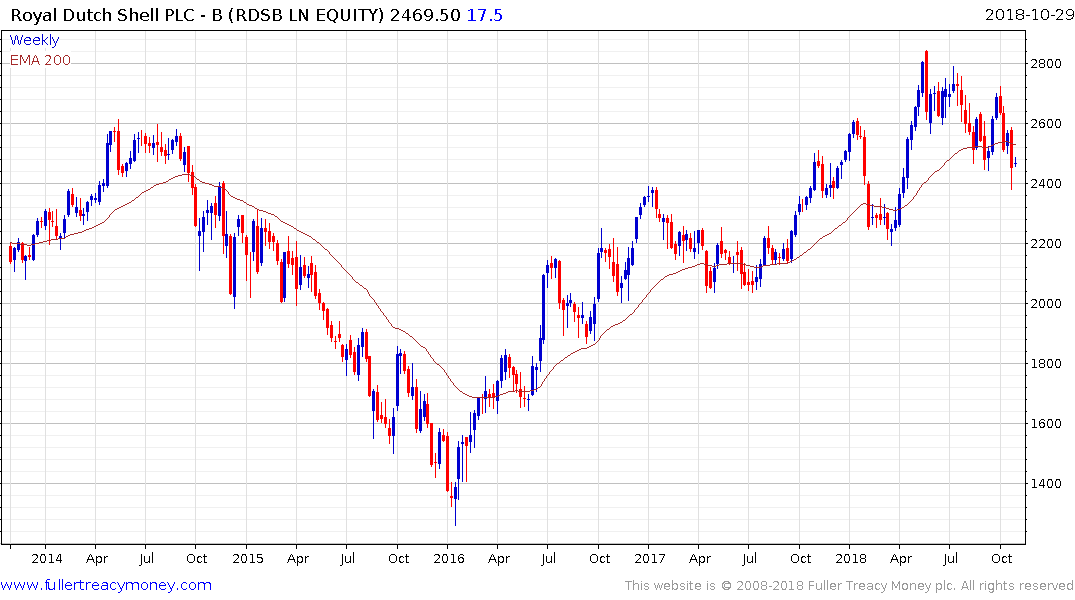
Royal Dutch Shell’s pivot to natural gas production more than a decade ago and increasing focus on that sector continues to pay dividends and the share yields 5.69%. It hit a near-term peak in June and is now back testing the region of the progression of higher reaction lows.
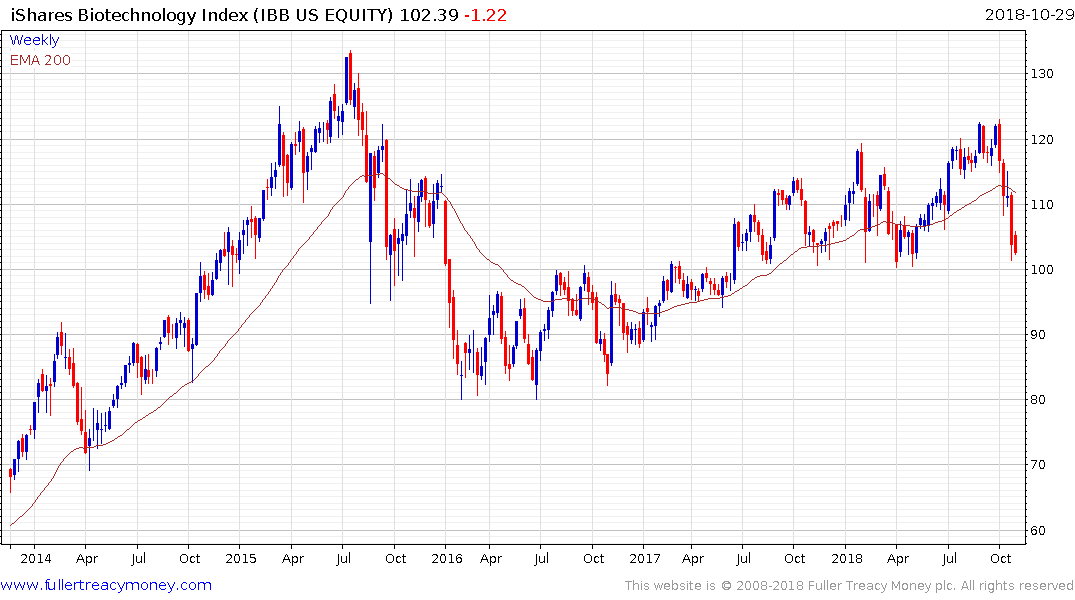
The iShares Biotechnology ETF (IBB or SBIO in the UK) posted a downside key reversal at the beginning of the month and is now testing the lows posted early this year. It needs to rally soon if support building is to given the benefit of the doubt.
The long-term outlook for biotechnology remains very positive. As quicker, cheaper and more detailed genetic testing, editing and synthesising reach commercial utility, the convergence of these technologies has the potential to deliver truly personalized medicine.
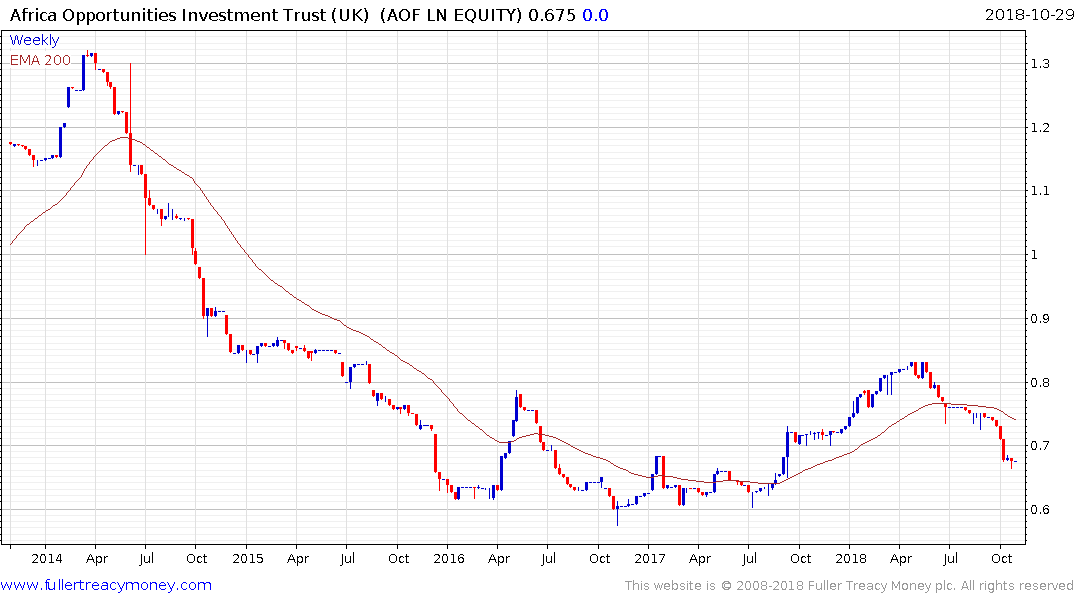
The Africa Opportunities Trust (AOF LN) trades at a discount to NAV of 22.72% and broke out to new recovery highs in April. It is now trading below the trend mean and while short-term oversold, it will need to sustain a move back above the trend mean to confirm a return to demand dominance.
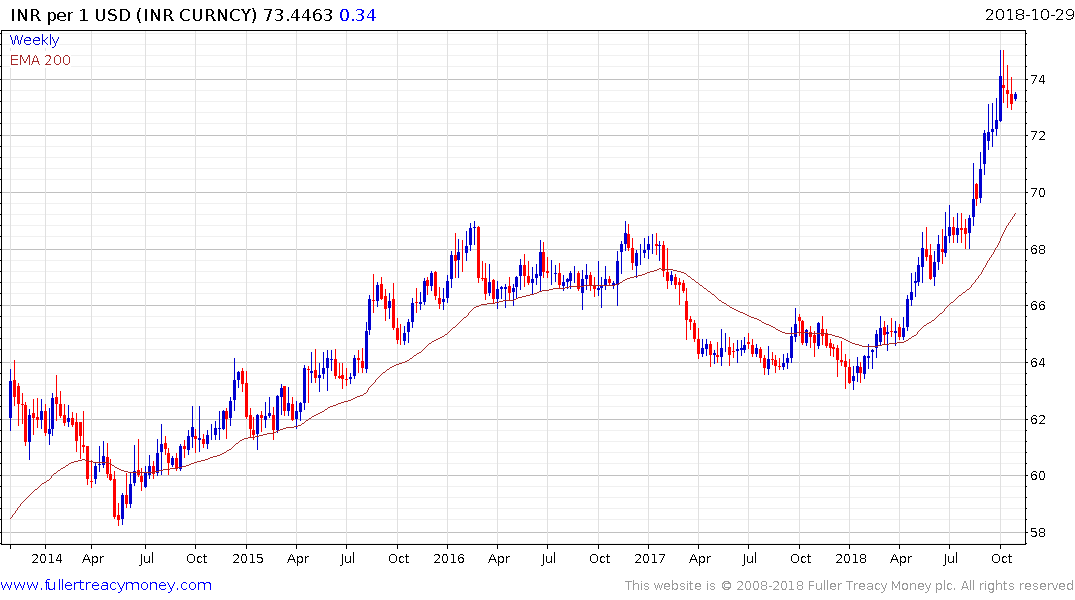
Longer term, India remains one of our favourite markets and is a potential beneficiary from trade tensions between the USA and China. However, the Rupee broke downwards on August 13th to new all-time lows and that represents a headwind for foreign investors as long as it persists.
The rollout of 4G to the whole country, combined with the completion of the nation’s biometric data collection efforts, suggest India is on the cusp of a digital growth phase that could help drive outpaced economic expansion for the foreseeable future. Nevertheless, India does not exist in a vacuum and a stable currency is a necessary ingredient to encourage foreign investment.
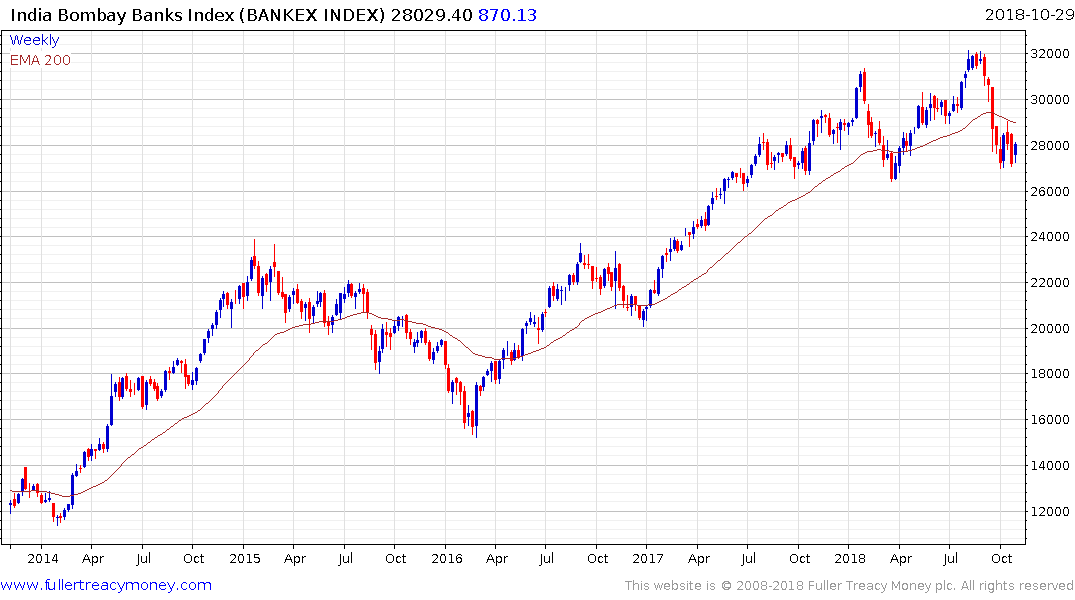
The pressure the banking sector is coming under as a result of closer central bank scrutiny of their operations is a medium-term bullish factor but is weighing on sentiment until investors have greater visibility on just how much an issue nonperforming loans represent for the major lenders.
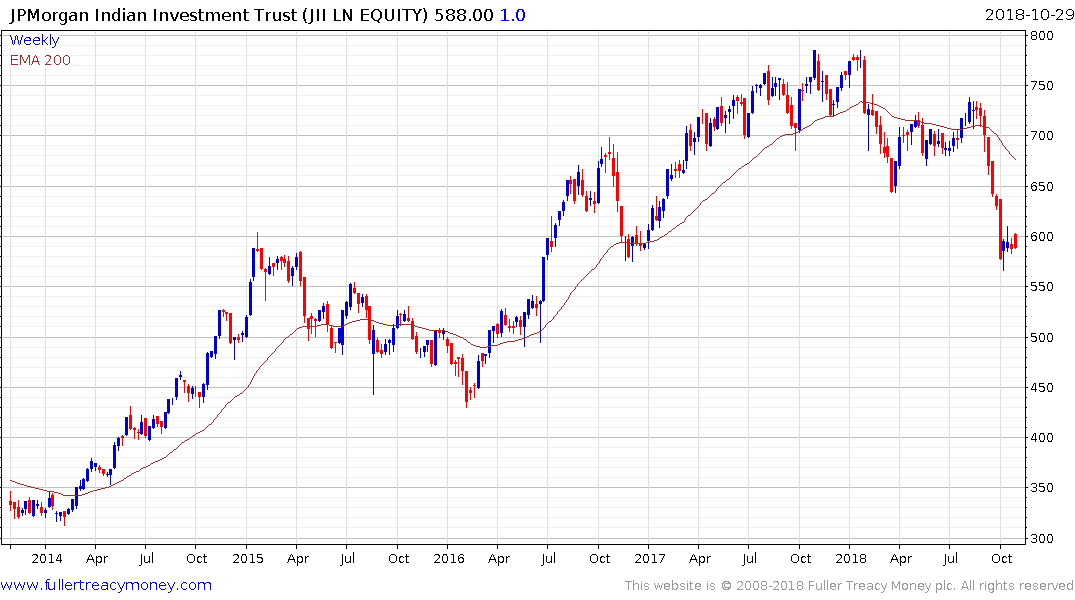
The JPMorgan India Investment Trust trades at a discount to NAV of 13.35% and has first step below the Type-2 top formation completion characteristics suggesting a lot of work will be required to signal a return to demand dominance.
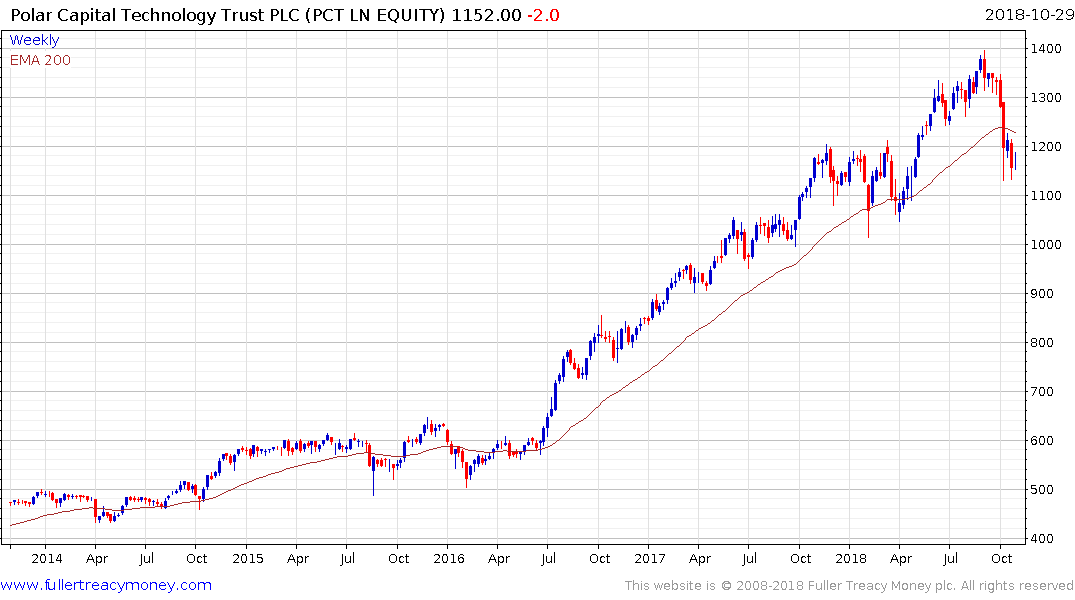
The Polar Technology Trust (PCT UK) now trades at a discount of 4.98%. It hit a new all-time high on August 9th but has now fallen back below the trend mean and into the underlying trading range. Considering how consistent the trend has been since the breakout in 2016, a MidPoint Danger Line stop could be appropriate near 1100p.
The evolution of the subscription business model has revolutionised the balance sheets of many technology companies; turning them from highly cyclical businesses into cash cows. That has made their businesses easier to model and affords investors the opportunity to justify a higher multiple. That has been one of the defining characteristics behind the consistency of some of the largest tech companies.
Japan
If I am in fact correct that the decades long period of global disinflation is ending then Japan is one of the places most likely to benefit since they have been chasing inflation for so long. One of the least reported changes to Japanese society is the growth of immigration which has the capacity to break the decades-long cycle of deflation. There is the real prospect Japan is in a new secular bull market.
That suggests some exposure to Japan in one’s portfolio is likely to be beneficial. The Dollar’s rally over the last few months has resulted in it breaking out above the ¥110 area against the Yen suggesting a return to medium-term demand dominance.
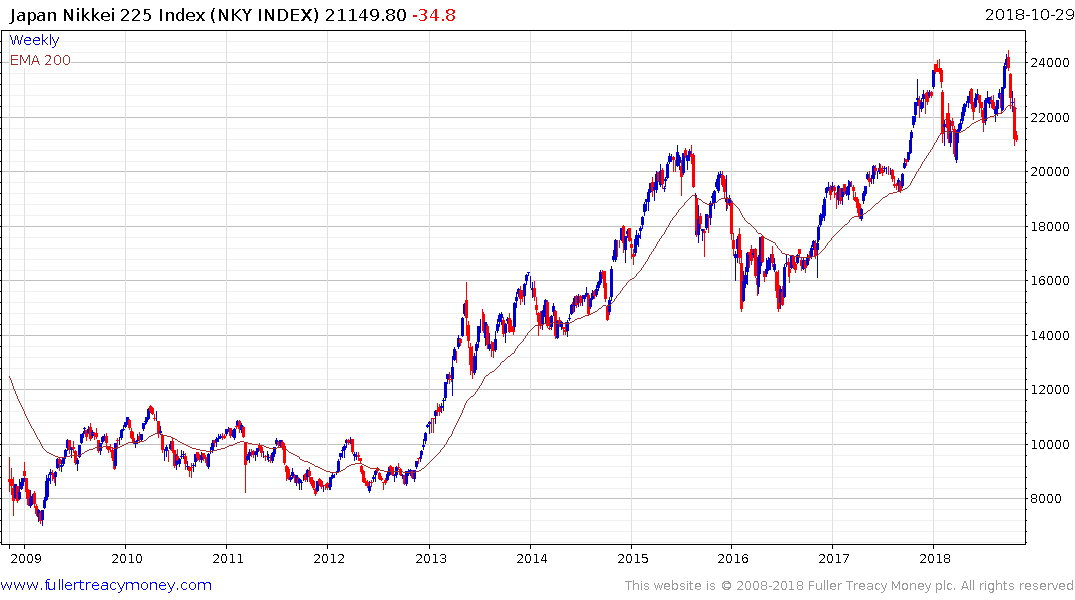
Japan has not been immune from selling pressure on international markets and a sustained move below 20,000 on the Nikkei-225 would be required to question the secular bull market hypothesis.
Hedged exposure to the Japanese market is available via the Wisdomtree DXJ ETF in the US, the similar UK fund is IJPH.
In particular the Banking sector has been depressed but is a high beta play on rising inflationary expectations. DXJF is a US listed US Dollar hedged ETN focusing on the Japanese banking sector.
We originated the term Autonomies for globally oriented companies that dominate their respective niches, benefit from the trend of capitalism towards consolidation and from the growth of the global consumer, energy revolution and technology innovation. The universe of shares I identified as Autonomies in 2012 can be found through this section of the Chart Library. You will notice that the shares represent a cross section of truly global operations with high growth and dividend aristocrats both present. They all share the commonality of dominating their respective niches on a global basis.
One of the other reasons we focused on internationally oriented companies is because we believe they can offer some of the best hedges against inflation. That is particularly true of consumer staples type companies with deep international brand recognition. The bond-like qualities of their cash flows resulted in them coming under selling pressure as bond yields became more competitive. A rebound is now underway since dividend yields have risen.
Generally speaking producers of widgets encounter competition which reduces the price to often unprofitable levels. At that point some of the weaker producers go out of business and a process of consolidation unfolds. The competitive Amazon marketplaces is a good example of this where producers of widgets compete on price to gain market share only for many to disappear after a relatively short time to be replaced by lower cost producers.
However, there are also sectors which, have been dominated by oligopolies for lengthy periods. Coffee, tampons, iron-ore, water, chocolate, running shoes, aircraft, beer, tobacco, cosmetics, industrial gases among others all fit into this category which is why I made a point of identifying the clear leaders in a sector when formulating the list of Autonomies.
This drive for oligopoly is referred to as a moat in the technology sector. Search, ecommerce, streaming, microchips, big data, social media companies all strive for this kind of dominant market positions. Facebook by acquiring WhatsApp and Instagram helped to secure its moat while the continued questions about Snapchat is that it does not have enough of inhouse IP and infrastructure to secure its own future.
I think it can be argued that the adoption of a subscription business model facilitates the preservation of brand loyalty because the consumer has so much more of a vested interest in continuing to participate with the brand over the medium to long term. That has been a particular innovation for the technology sector which has transformed highly cyclical businesses into something akin to high growth consumer staples.
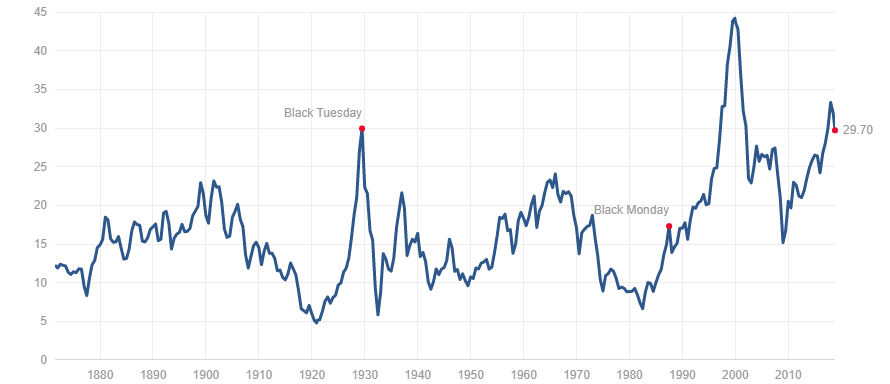
Against that optimistic perspective is the argument that the Shiller Cyclically Adjusted P/E is at its 2nd highest level ever. That tempts us to conclude the market is fully valued and therefore has little scope for additional upside. However, the measure is not a timing tool. It tells us we are not early in the cycle but not much more. What is to say that it will not move to a new all-time high before reversing? The Shiller CAPE is liable to experience mean reversion from time to time, but it is not a consistent trend and therefore is a lot harder to draw useful conclusions from in my opinion.
If capitalism trends towards consolidation, then anti-trust is the logical catharsis from the feeling of injustice people feel at the dominance of one company over all others. Populism is, at its root, a revolution against the status quo. More than any other factor the status quo is represented by the utter devotion to social democratic policies which have increased the debt load over decades.
In my view there are three potential issues which populist movements in their various forms can target. These are globalization, debt inequality and anti-trust. Of these, anti-globalisation is the primary argument gaining traction right now but that does not preclude the possibility that the others will not also form part of the market discourse over the coming years.
At the present moment the Autonomies are being traded as if they all bear the same risk from protectionism. That is not the case but it will likely take time for investors to be willing to differentiate.
.png)
I co-manage a UK listed OIEC which runs an equal weighted strategy and rebalances once every quarter into the 100 with the most attractive chart patterns and relative performance. It has a management fee of 0.55%.
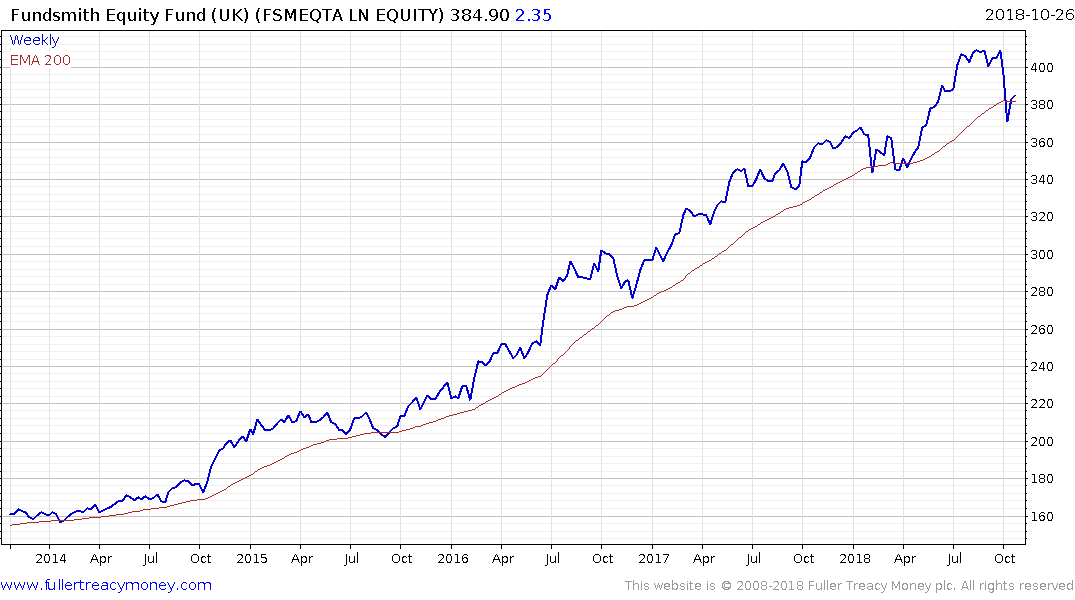
The UK listed Fundsmith Equity Fund also invests in global themes but on a more concentrated and active basis and charges 1%.