
Long-Term ratios

I have been ruminating on the interrelationships between markets over the last couple of months and that has been a significant topic of conversation in the Big Picture Friday Audios. There are changes which have taken place over the last few months that need to be viewed in the context of generational long trends because I believe they give us some perspective on what we can expect from markets over the next decade.
The Dow/Gold ratio has been a reliable barometer of the interplay between the performance of stock markets versus commodities for more than a century. Each higher high for stocks has been a factor of the reduced purchasing power of paper money coupled with improving productivity over the long-term. There were also between 35 and 37 year between the peaks with the last being in early 2000.
It was reasonable to expect with the peak in gold in 2011 and the breakouts to new all-time highs by Wall Street in 2012/13 that the ratio was on a new secular advance which would take it to a new all time peak sometime in the mid-2030s.
The ratio has now broken that nine-year uptrend. That’s not supposed to happen and it raises important questions about the efficacy of relying on the long-term ratio as a predictor of future asset class behaviour. The last thing I want to do is rationalise the price action. The ratio has clearly broken its uptrend. That suggests gold is more than likely going to continue to outperform the Dow Jones Industrials Average for the foreseeable future.
However, it also raises some additional questions which need to be addressed. The first is the rationale for relying on the Dow/Gold ratio, was industrials represented the basis for the economy and gold represented fundamental value in all circumstances. Today, the Dow is defined as an average of blue-chips which dominate their respective niches and includes everything from industrials, financials, retailers, consumer stocks and technology. The additional question is whether gold has had a competitor as the basis for hard currency in the form of oil.
The Nasdaq Composite / Gold Index has not broken down. Since the Index is heavily weighted by the technology sector, it is reasonable to conclude the stock market sectors most likely to outperform gold in the enfolding global environment are the growth leaders.
The evolution of the petrodollar economies following Nixon’s breaking of the gold standard led to gold and oil ranging against each other for decades. However, the value of oil as a store of wealth has collapsed over the last couple of months with gold now trading at 100 times the price of West Texas Intermediate.
From a trader’s perspective oil is cheap based on every historical measure. However, from a long-term perspective the commodity is in a secular bear market. Therefore, there will be spectacular trough to peak swings but it is likely to range more than trend for the foreseeable future. Peak internal combustion engine is a very real possibility this decade and therefore oil relies on massive growth in subsidiary products like chemicals, plastics, jet fuel and hydrogen to prosper. The petrodollar financial system is the most at risk of collapsing over the next few years as a result.
Therefore, if we look at the Dow/Oil ratio we are presented with the opposite of the Dow/Gold ratio. The Dow has surged relative to oil and each of the peaks over the last 130 years are still higher than the most recent. This collapse in oil is going to result in a massive supply shock as oil producers go bust and that will eventually result in the ratio contracting again as oil rebounds from its lows.
Gold has been very firm and oil has been very weak so do we get more information by looking at a commodity Index rather than individual commodities? The Dow/Continuous Commodity Index is particularly interesting right now because it contains both gold and oil but is unweighted so does not give an undue weight to either. The ratio took out the 1999 peak in 2018 and rebounded impressively from its March lows to challenge the all-time peak over the last few weeks.
This suggests gold is in a clear uptrend, but while there will be sporadic outperformance of individual commodities, the wider picture is for stocks to continue to outperform. Therefore, the trend that is evolving is a hard money argument rather than any particular strong demand picture for commodities.
Unhedged gold miners are still trading cheap on a relative basis compared to the gold price.
All of these comparisons do not take account of inflation. Gold adjusted for CPI approximated the 1980 peak in 2011 and is now rapidly rising toward that area again. It is very likely we are going to see new all-time inflation adjusted gold prices.
When adjusted for purchasing power parity we are delivered a similar picture.
When we adjust oil for purchasing power parity, we have confirmation it is at the lower side of a very long-term range.
The purchasing power parity adjusted chart for the S&P500 clearly highlights the sequence of long-term ranges one above another. Support in the 300 area suggests the March low is unlikely to be superseded.
Both the Nasdaq Composite and the total return on 10-year Treasury futures remain in bull markets.
It’s easy to argue for why government bonds should underperform but we currently have more deflationary fears despite the background of inflationary pressures. Inflationary pressures are on the horizon however.
This article from CNBC, kindly forwarded by a subscriber, highlights how a significant number of people in the USA are making more from unemployment than from working. To encourage them back to work many people are likely to demand higher wages. There is not much anger being expressed right now because of the lockdowns. People are being adequately compensated for the loss of income. The growing question is how they will be compensated for the loss of unemployment income when lockdowns end?
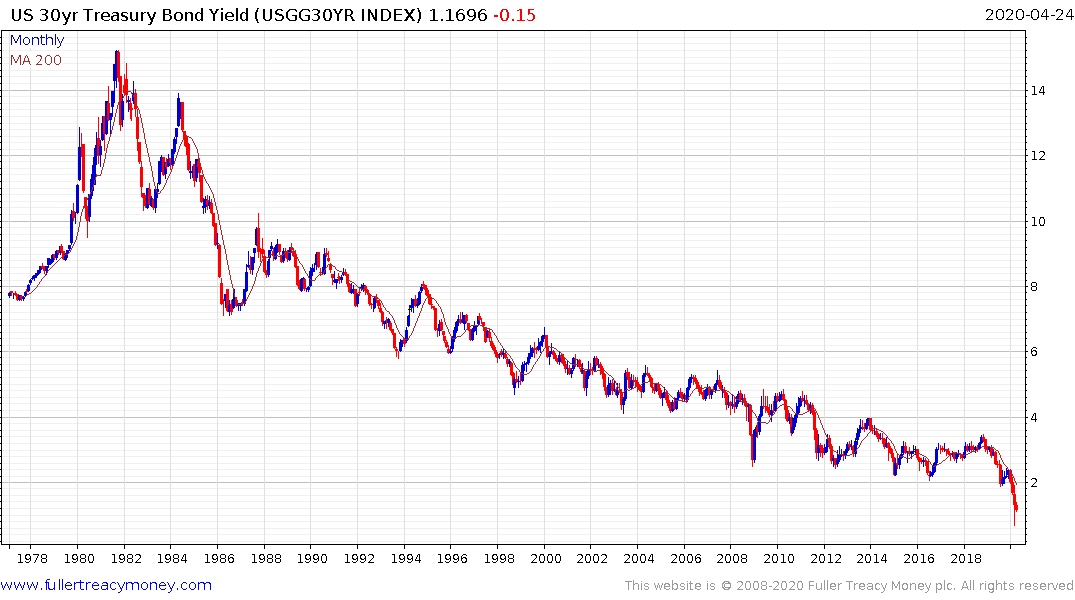
The clearest signal inflation is making a comeback would be if the 30-year Treasury yield rises above 2% on a sustained basis.
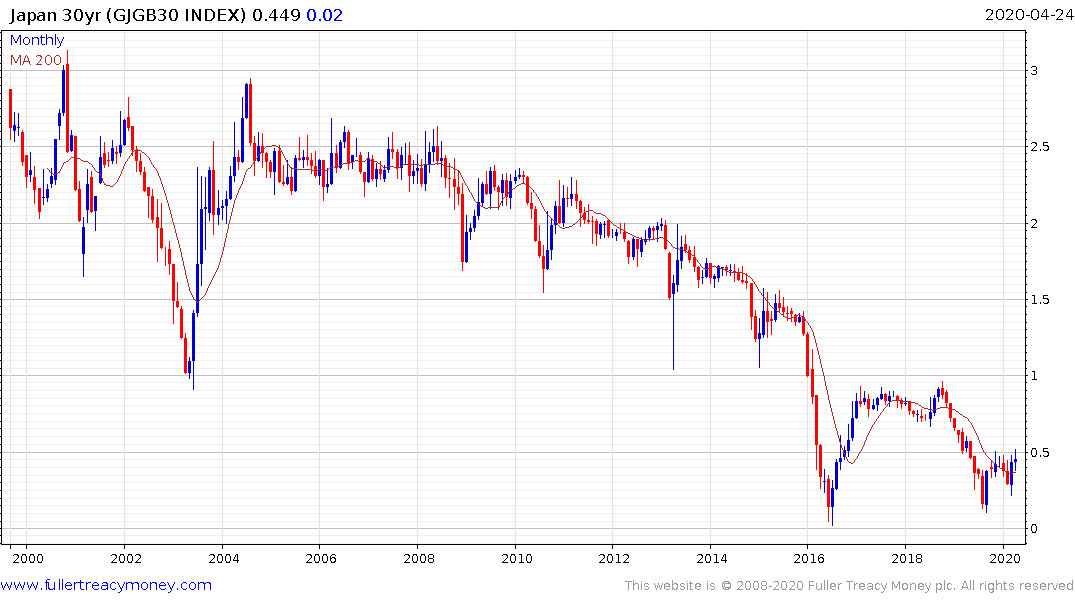
Interestingly Japan’s 30-year yield is advancing and a sustained move above 1% would break the long-term compression of yields.
Until these trends break, bonds are still in a secular bull market.
Back to top