Long-Term Asset Return Study - Bonds: The Final Bubble Frontier
Thanks to a subscriber for this heavyweight 104-page report from Deutsche Bank which may be of interest to subscribers. Here is a section:
We ask whether bonds are the final bubble in what has been a near two decade rolling series of inter-related bubbles? After the Asian/Russian/LTCM crises of the late 1990s we entered a super cycle of very aggressive policy responses to major global problems. In turn this helped encourage the 2000 equity bubble, the 2007 housing/financial/debt bubble, the 2010-2012 Euro Sovereign crisis and arguably some recent signs of a China credit bubble (a theme we discussed in our 2014 Default Study). At no point have the imbalances been allowed a full free market conclusion. Aggressive intervention has merely pushed the bubble elsewhere. With no obvious areas left to inflate in the private sector, these bubbles have now arguably moved into government and central bank balance sheets with unparalleled intervention and low growth allowing it to coincide with ultra low bond yields.
This is not to say the bubble will pop in the foreseeable future. The bubble probably needs to continue in order to sustain the current global financial system and the necessary future deleveraging. However future inflation or, even more extreme, the risk of sovereign restructuring would mean most government bondholders are unlikely to achieve a positive real return over the medium to long-term. There is a narrow corridor for future performance with yields recently moving significantly lower in many parts of the world and with debt levels still moving higher. It is because of this that we would argue bonds are exhibiting bubble tendencies.
Indeed bond yields are currently close to multi-century, all-time lows in many European countries and in their lowest decile in virtually all others. However real yields are less extreme, having been lower on 20-40% of occasions through history for most countries and are currently closer to median levels in the periphery. This is the most compelling argument for suggesting yields could still move lower in the near-term whatever the medium-term view.
Real yields are higher due to low inflation. However current inflation at the global level is not actually as low relative to history as the perceived wisdom suggests. In the US and UK it’s currently around median levels seen since 1790 and 1693 respectively. If we narrow the analysis period to the last 100 years, inflation in these two countries has been lower on 38% and 30% of the time. Looking at the same last 100 year period in Europe, inflation has been lower only 12% of the time for France and Italy and 9% for Spain. So it is here that the low inflation concerns are most justified.
Here is a link to the full report.
In 2005, when the Chinese government stepped in to support the equity market it fuelled the expansion of a stock market bubble. When Fannie Mae and Freddie Mac loosened credit standards in order to make mortgages available to people who would not previously have been eligible, a bubble inflated in the subprime sector. The creation of the Euro allowed cheap capital to be funnelled to peripheral countries which had not previously had access to such abundant low cost funds and bubbles developed in property, bank and sovereign debt. These examples highlight that government and central bank actions can create dislocations in the market which fuel speculation and ultimately result in a burst bubble.
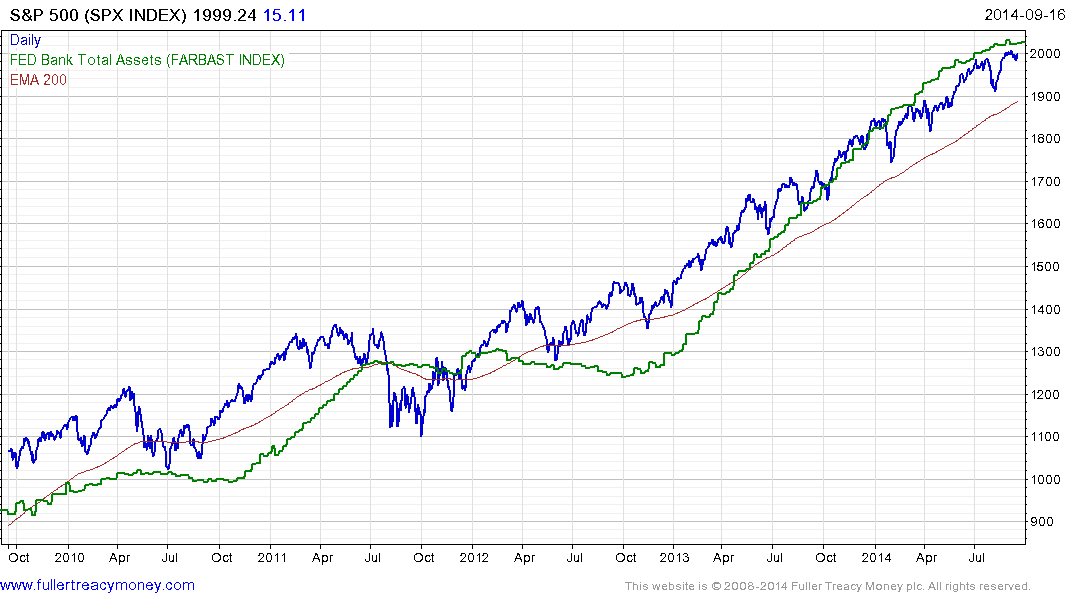
The Fed’s balance sheet has expanded to $4.4 trillion since 2006 and much of that money has been put to work in helping to compress Treasury yields and by extension mortgage rates. The ability of corporations to roll over debt and access fresh capital at record low absolute levels has also been of benefit to the stock market where buybacks have been a major source of demand during the last few years.

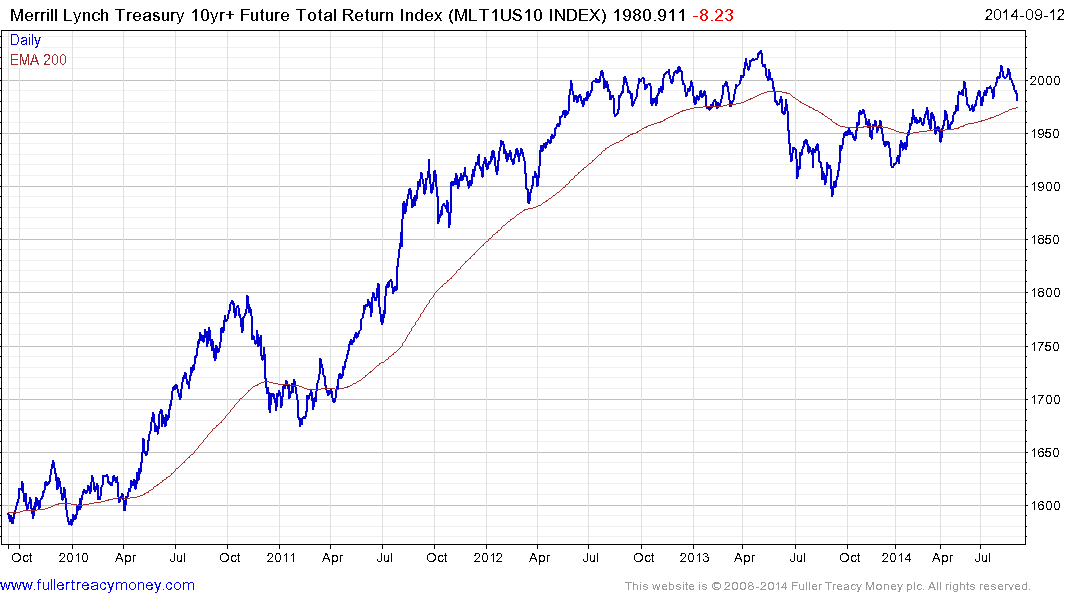
The Merrill Lynch 10yr+ Total Return Index on Treasury futures has top formation characteristics and coincidentally has paused at the same round 2000 level as the S&P 500 Index. The Index has experienced two-year consolidations in the past, though never from such lofty heights and had never spent as much time below the 200-day MA as it did in 2013. It has now pulled back to the region of the MA and will need to hold in this area if this year’s progression of higher reaction lows is to remain intact and top formation development is to be countermanded.
We can conclude from the moves in government bonds, not least in Europe, is that momentum is moving the market as investors bet on the ECB picking up where the Fed is leaving off in terms of quantitative easing.

The above chart of the S&P 500 overlaid with the Fed’s balance sheet illustrates that the last time the balance sheet’s expansion stagnated in 2011, the S&P experienced a deep correction and heightened volatility. As the market awaits Janet Yellen’s speech tomorrow and the expected end of QE next month, the potential for increased volatility is looking more likely.


