
In the Long Run, These Equity Losses Barely Register
This article from Bloomberg highlights the philosophical attitude being adopted following a couple of days of rather extreme volatility. Here is a section:
A momentous week has ended with a thud rather than a bang (at least on the data front) as the U.S. employment numbers came out broadly in-line with expectations. To be sure, there were some notable features of the data -- a drop in both household employment and labor participation, though perhaps that was driven by the timing of Good Friday, which fell during the survey week.
You can cherry-pick whatever you like from the figures to support your pre-existing view, so at this point it’s hard to say that they change much of anything. For now, the growth picture remains strong enough to support the policy trajectory that’s currently priced into rates markets. That, in turn, should continue to apply pressure to equities, regardless of how “cheap” they may seem.
From a macro perspective, the issue to focus on has clearly rotated from inflation to growth. Pretty much everyone understands that base effects will drive y/y CPI and PCE figures lower, but the run-rate of inflation will remain high enough for central banks to keep worrying ... and keep (or start) tightening. That policy trajectory will change when the growth outlook deteriorates significantly enough that demand looks more correctly aligned with supply. So that’s what we’ll be watching for.
While you can point to the 353k drop in household employment as a signal that the economy is weakening, that’s a pretty tenuous hook upon which to hang your hat at this point -- particularly given that household employment growth had comfortably outstripped the establishment survey over the prior six months. Moreover, the drop in the participation rate suggests the household figure may well have been a supply, rather than demand, issue -- which is problematic if the relatively elevated level of wages can still not attract fresh workers.

The pandemic economy is not the new normal. It was an anomaly fueled by money creation on a previously unimaginable scale. It is therefore reasonable to expect that unwinding much of the bonanza will be required to get inflation back under control.
Since asset prices surged during the pandemic that also suggests they will need to correct, potentially meaningfully, in response to tighter liquidity conditions. That is not going to be a democratic process. Just as accumulation of leverage tends to concentrate in a relatively small portion of the market, so too will deleveraging.
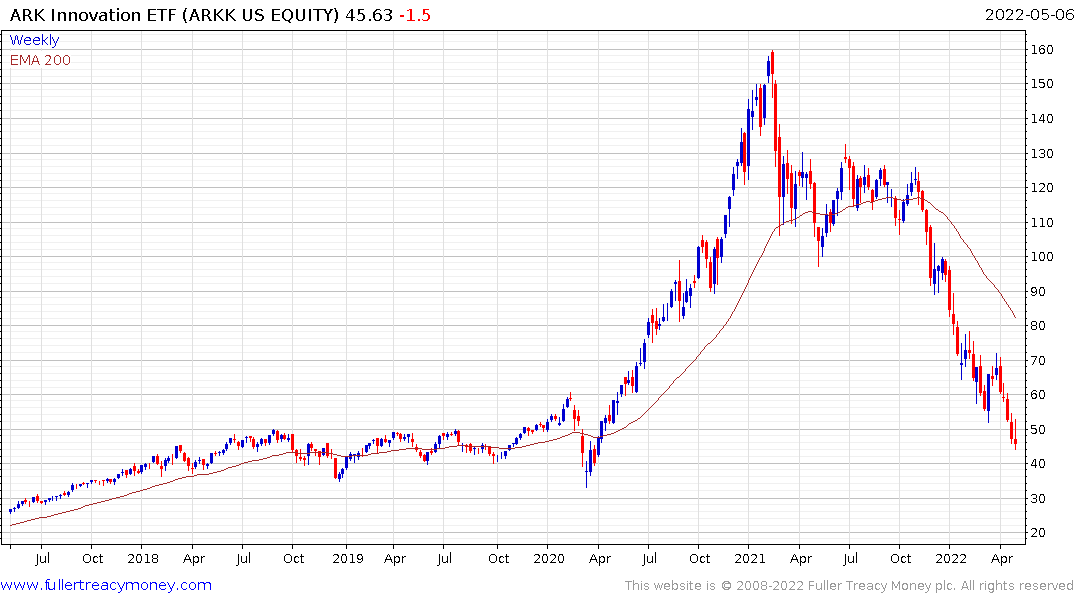
The brunt of selling pressure was felt first by the “innovation” sector. The ARK ETFs sold off aggressively from last November but peaked in early 2021. The main fund has fully unwound the pandemic surge. Bond yields are higher today than at any time since the 2018 failed upside break, so there is no reason to expect a recovery any time soon.
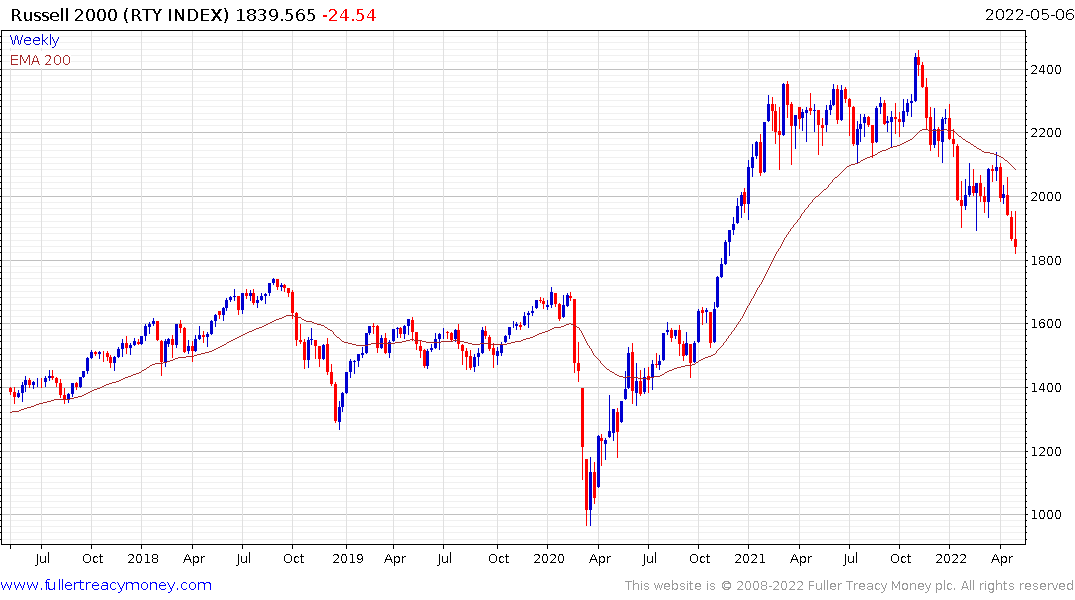
The Russell 2000 small cap Index was the next to go. It posted a large failed upside break in November, failed upside break, encountered resistance in the region of the lower side of the overhead range and the 200-day MA and broke lower again this week. This continues to look like a completed Type-2 top formation.
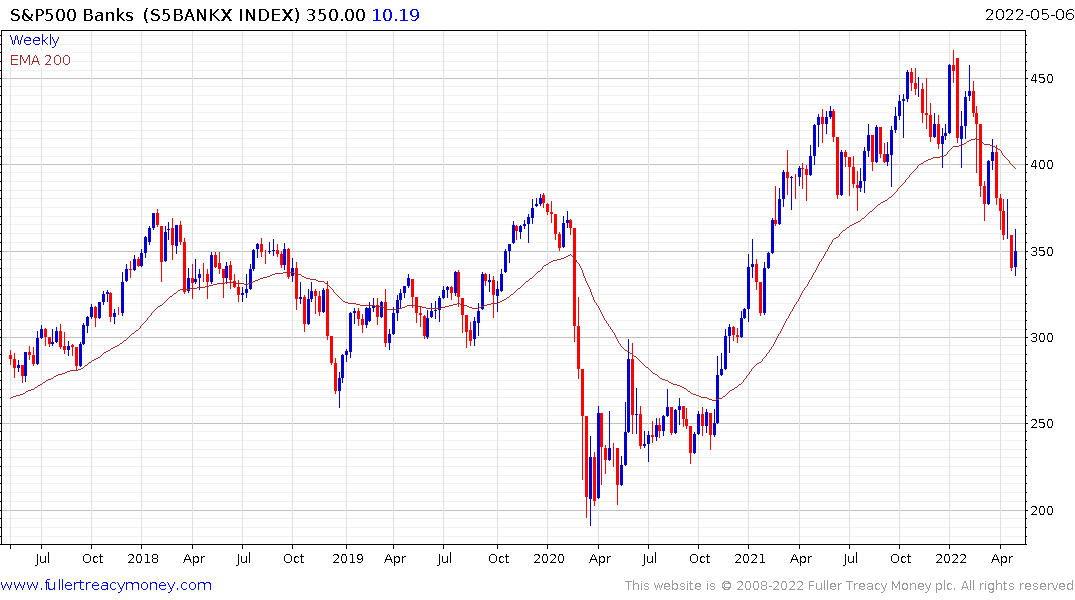
The S&P500 Banks Index is also back testing the region of the 1000-day MA. Historically higher interest rates are positive for banks, but the flat yield curve and absence of refinancing income is weighing heavily on their business models.
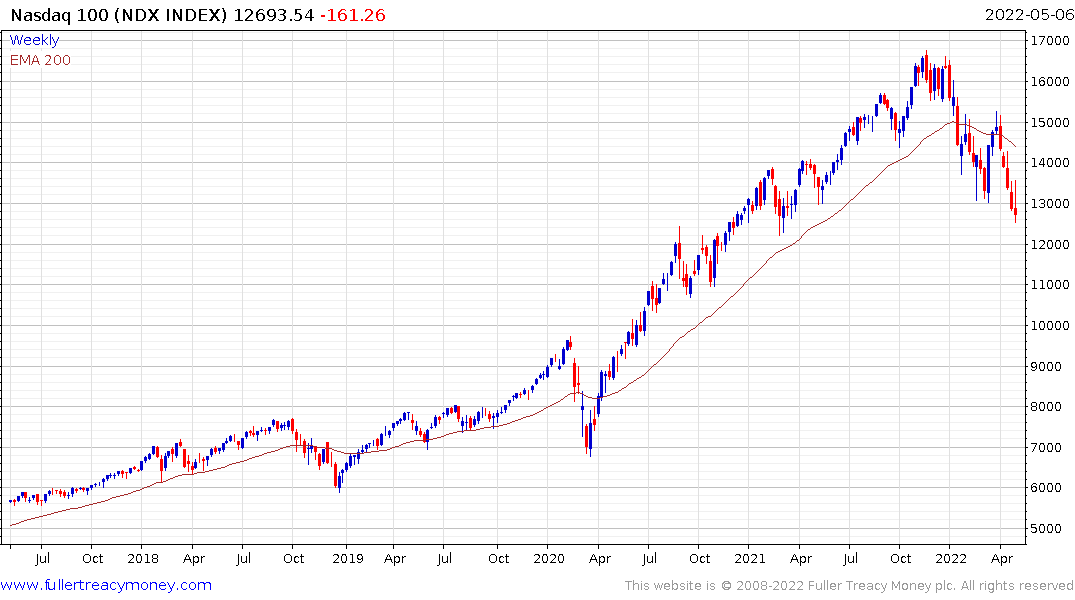 The Nasdaq-100 failed to hold its sequence of higher reaction lows in January and continues to encounter resistance in the region of the 200-day MA. It broke down to a new low this week and while oversold in the short-term, the medium-term downward bias is clear.
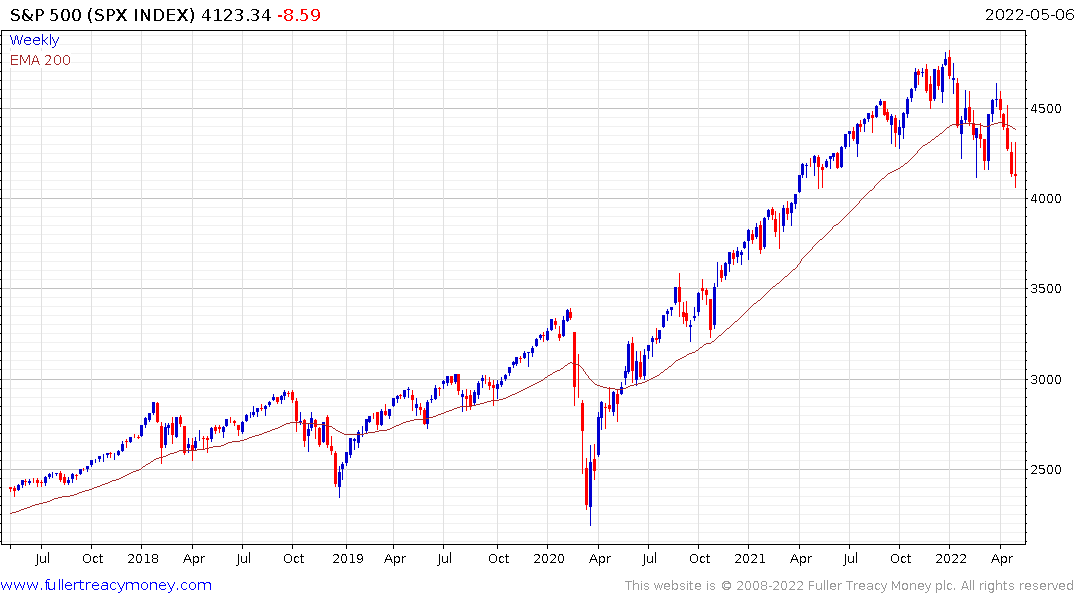
The S&P500 is now following the Nasdaq-100 lower.
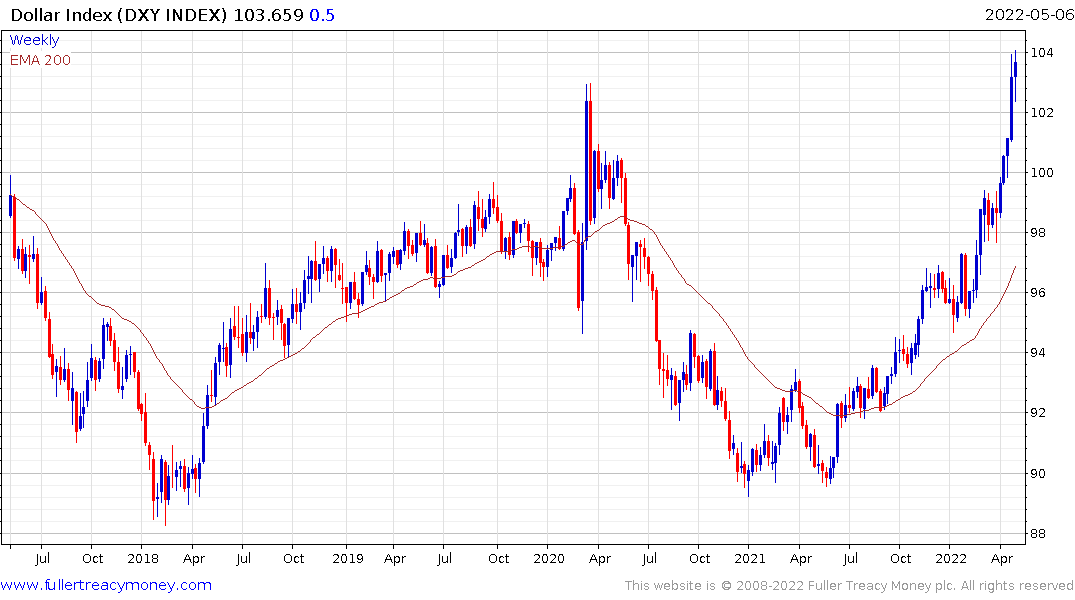
The Dollar Index remains in consistent uptrend which helps to keep some of the upward pressure on commodities from skewing inflation numbers. The uptrend is heavily dependent on the outlook for the Fed continuing to raise rates faster than other developed countries.
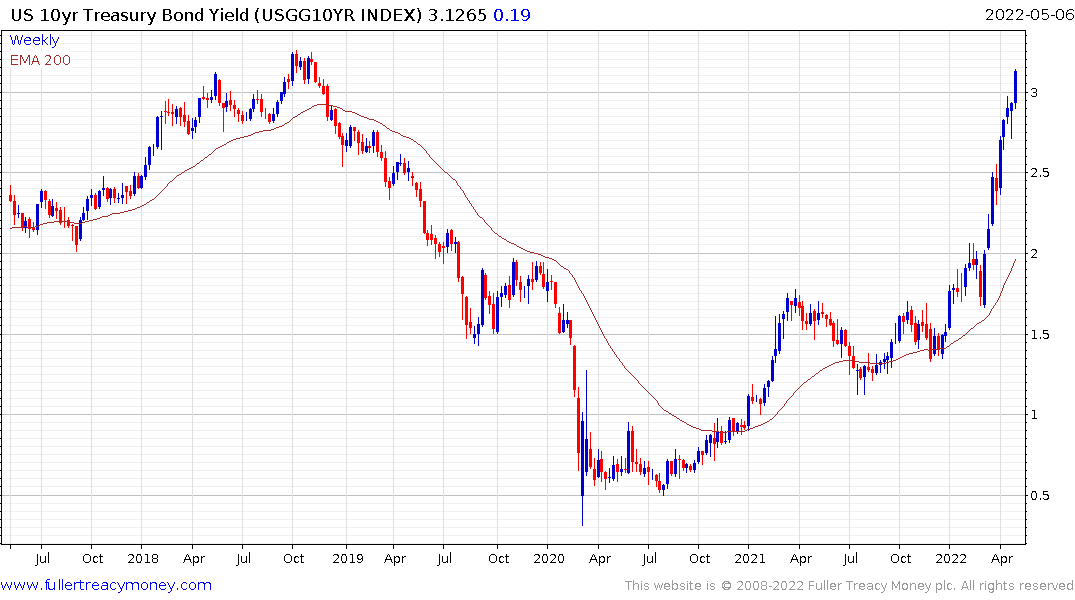
Meanwhile 10-year yields continue to extend the break above 3%.
I agree that the size of moves in large cap indices are still comparatively modest compared to the volatility posted in the 1970s. However, the move in bonds is the biggest selloff in decades. It clearly shows up on the long-term log scale of the total return on Treasury futures, as the Index trends down through the 1000-day MA.
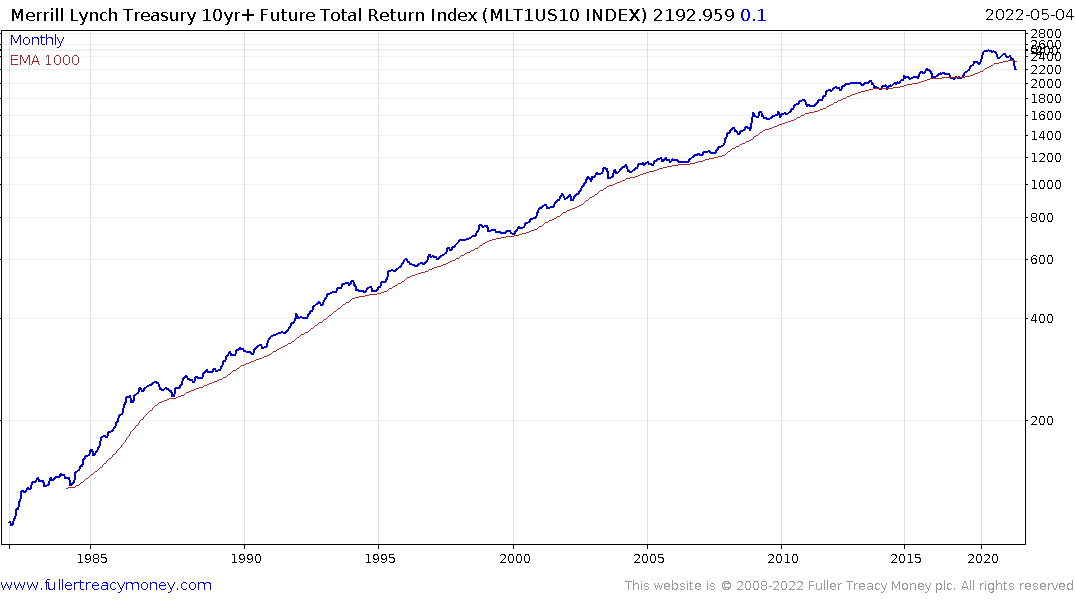 This is looking increasingly like the end of an epic bull market in fixed income. It also implies the discount rate used to value all assets is trending higher. That suggests earnings misses will lead to stock prices being eviscerated in the months ahead while beats will be celebrated. There are short-term oversold conditions but until we see some evidence that monetary conditions are going to loosen asset prices are going to remain under pressure.
I got an email from my bank yesterday telling me house prices in my area have risen 20% in the last year and letting me know how much I could borrow against it. Financial conditions have tightened, but money is being thrown at consumers from every corner. How can inflation be brought back under control while that remains the case? The Fed is unlikely to relent in tightening until there is clear evidence of demand falling.
Back to top