
Golds (OW): Debunking the Bearish Case for Gold(s)
Thanks to a subscriber for this report from Canaccord Genuity. Here is a section:
Gold(s) perform poorly before/after the first Fed hike. This was true over the last three tightening cycles of 1994-95, 1999-2000 and 2004-2006 (Figure 1) where rate hikes were ¡§mechanical¡¨ in nature, that is, the Fed raising rates by a 25bp increment at each meeting. But as Fed Chair Yellen repeated yesterday through the Q&A session, contrary to these episodes, the Fed does not intend to follow a pre-determined path to higher interest rates. Rather, a ¡§gradual¡¨ or “wait-and-see” approach was reiterated. Therefore, the next few months may well look like the 1986-87 tightening cycle where golds outperformed before and after the first Fed hike (Figure 1, fourth panel). Interestingly, the 1986-87 experience teaches us that despite a Fed hike in December 1986, gold equities surged until the second Fed hike which occurred in April 1986. So, if the Fed were to pre-emptively hike rates in September, the Fed could take a pass in December and the second hike could only happen next year if a “gradual” approach is implemented. This scenario could maintain or open the door to a cyclical rally in gold and gold equities.
Inflation is low and years away. Inflation went down to a multi-year low of 2.3% in 1993 and the gold sector rose 115%. Back to the 1986-87 episode, who would have said that in December 1986, US headline CPI would bottom at 1.2% and boom to 3.7% four months later? Interestingly, like today, the third panel of Figure 2 shows that wage inflation was running ~2%. The bulk of the inflation increase in 1987 came from the rebound in oil prices. We calculated that if oil prices reach $70/bbl next spring, US headline CPI would be near 2%. But like in early 1987, by moving progressively, the Fed runs the risk of allowing inflation expectations to build as headline CPI catches up to core CPI, hence the “inflation” trade on gold(s). The key points to remember here are the trend in inflation and expectations. Figure 3 shows that no matter the starting point in inflation, gold equities historically are strong outperformers (+18%>TSX over 12 months) from historical bottoms in US headline inflation. Yesterday’s headline CPI suggests the disinflation cycle is over.

Here is a link to the full report.
The range of opinions on the outlook for gold remains varied. The majority of commentary focuses on the “what ifs” of how gold will respond to different stimuli not least the Greek drama and potential Fed tightening, but what it really needs is a good argument for why it should rally independently of other factors. Gold has been ranging with a mild downward bias for nearly two years so it is reasonable that investors are looking for a bullish catalyst to galvinise support beyond short-term steadying.
.png)
Platinum broke downwards to new lows last week and extended the decline today. A clear upward dynamic will be required to check momentum, while a sustained move above $1200 would be needed to question the medium-term downward bias.
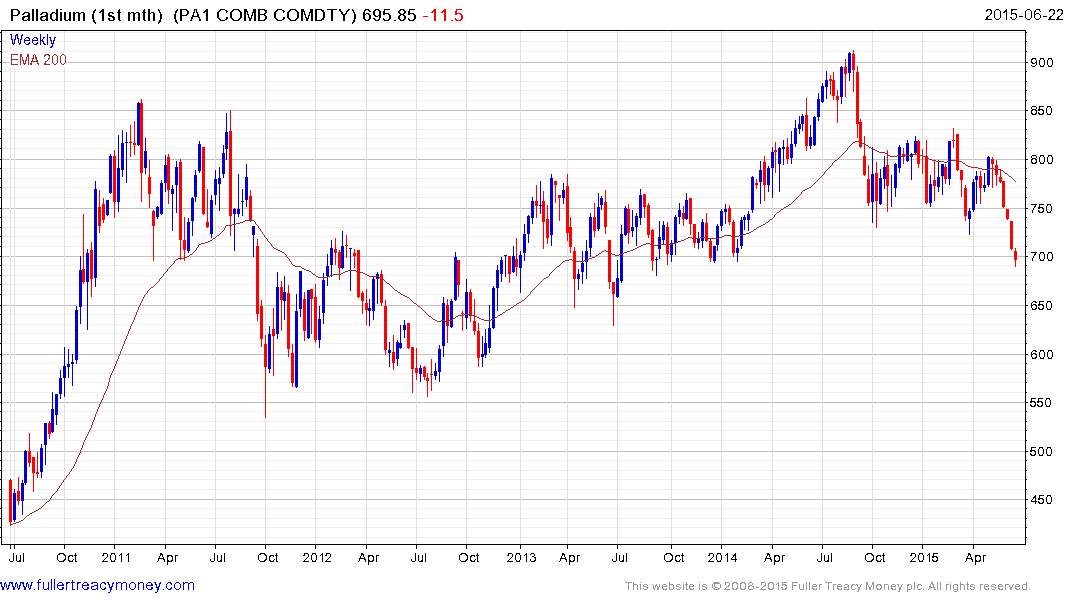
Palladium has previously been a stalwart in the precious metals sector but has fallen for the last five consecutive weeks. A short-term oversold condition is evident but there is no sign yet that support has been found in the $700 area.
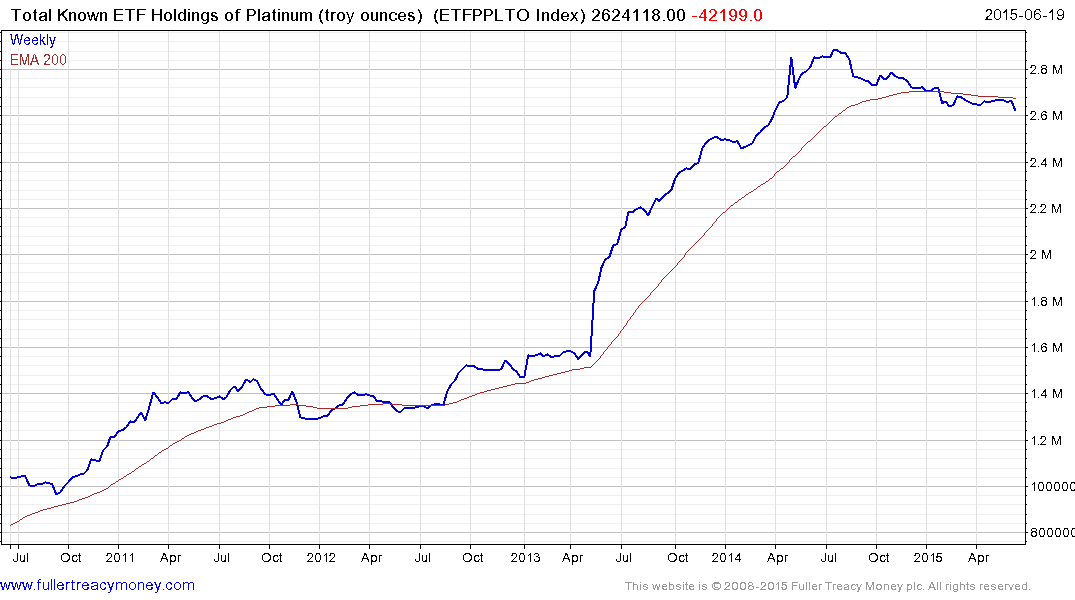
It might be argued that industrial demand accounts for more of the platinum and palladium markets than gold and that the evolution of electric cars represents a headwind for these metals. However that would be to ignore the fact that platinum in particular has jewellery and investment characteristics with ETF holdings of platinum hitting 2.88 million ounces a year ago. ETF holdings dropped below the 200day MA in January and moved to a new reaction low today to extend what is a yearlong decline. .
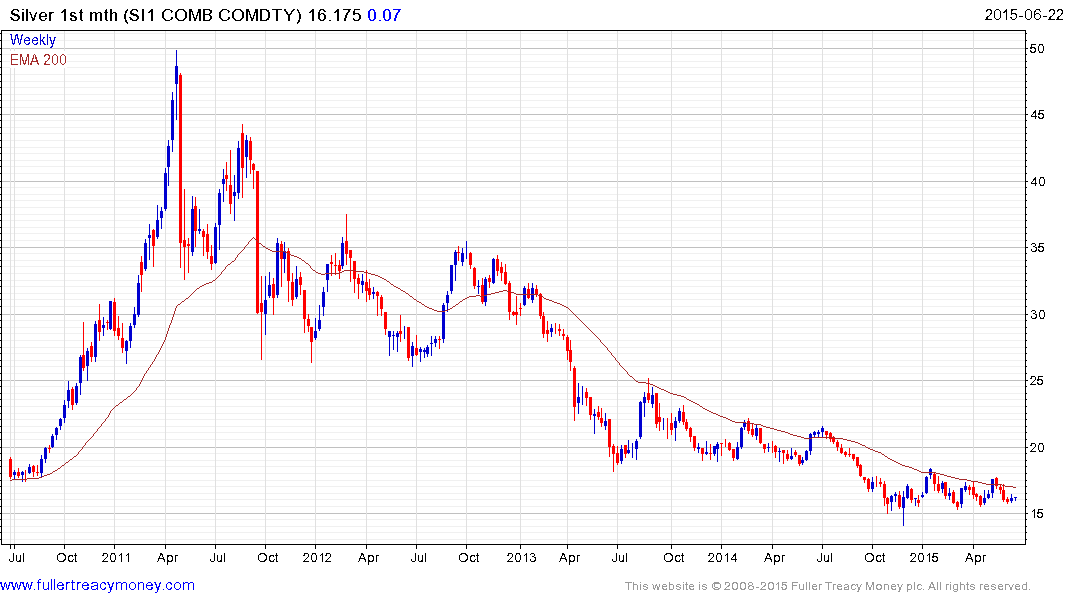
Silver has stabilised mostly above $15 since late last year but will need to sustain a move above $17 to suggest a return to demand dominance beyond the short term.
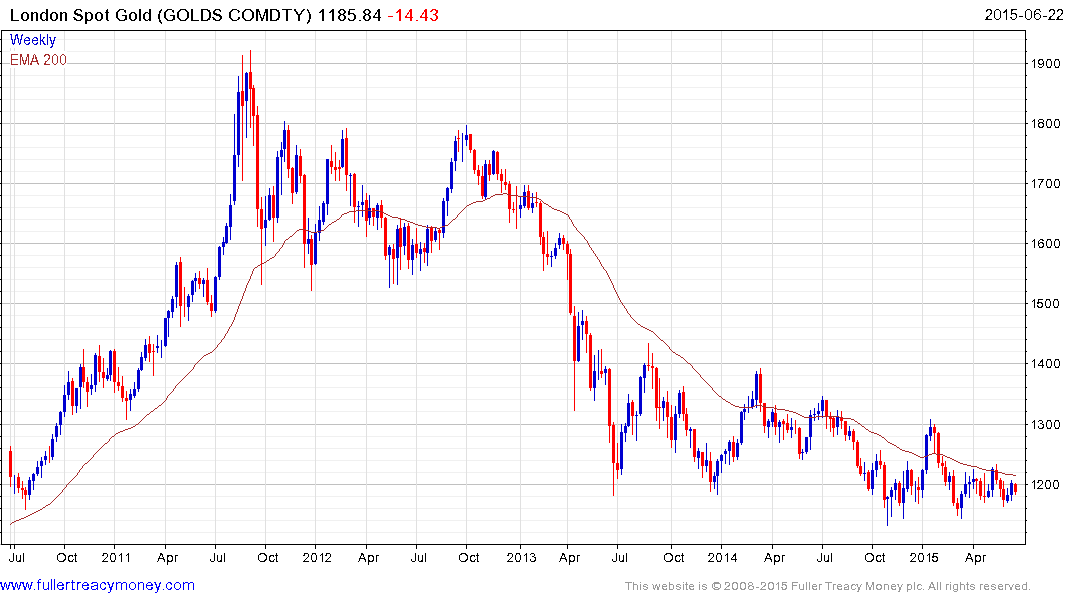
Against this background gold is in need of a bullish catalyst and is currently pulling back from the region of the 200-day MA. A sustained move above $1200 will now be required to question potential for additional lower to lateral ranging. At The Chart Seminar we explore the dynamics of range formation and completion and conclude that a range is an explosion waiting to happen.
Gold’s range will eventually be resolved by a breakout. At the present time the odds are more in favour of a downward break than an upward break and a sustained move above $1200 would now be required to question that view.
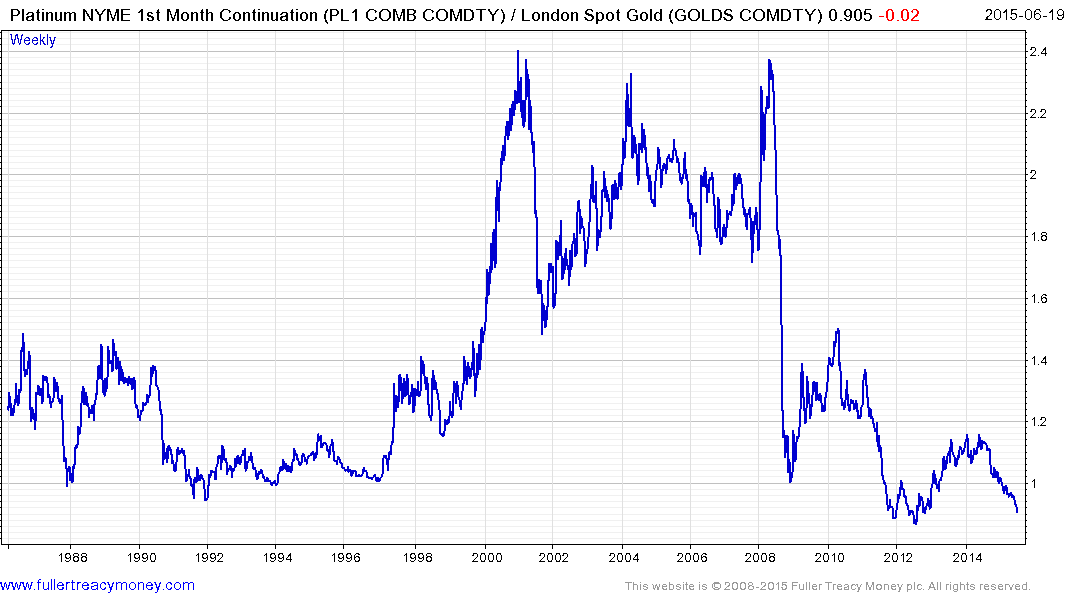
I mentioned the Platinum / Gold ratio in the Subscriber’s Audio over the last few weeks so I thought I would reproduce it here. Trading over the last three years looks quite different to what we saw in the 1988 to 1998 period. This might be reflective of the changing dynamics in demand for platinum but from a technical perspective the ratio is coming back to an area of potential support. If it bounces it will either be because gold pulls back to meet platinum or vice versa.