
Fed Seen Holding Rates Steady, Ending Bill Purchases by June
This article by Christopher Condon and Sarina Yoo for Bloomberg may be of interest to subscribers. Here is a section:
Economists had a broad range of forecasts for when the Fed would stop buying Treasury bills, though June 2020 received the highest response at 43%. Respondents overwhelmingly expected officials will taper the monthly purchases rather than stop them suddenly. The Fed has been buying $60 billion in T-bills each month since October.
A scarcity of bank reserves was blamed for an unexpected spike in overnight funding rates in September. This led the fed funds rate to stray briefly out of its target range. The new cash created by the Fed’s T-bill purchases has since relieved that scarcity. The Fed, intent on ensuring an ample supply of reserves, has said it will continue the purchases at least into the second quarter.

The news headlines are full of news about the coronavirus and the number of countries where it has been found continues to rise every day. That injected a degree of caution in the markets that was not present a week ago. The clearest effects are evident in safe haven assets where Treasuries, precious metals and the Dollar have steadied.
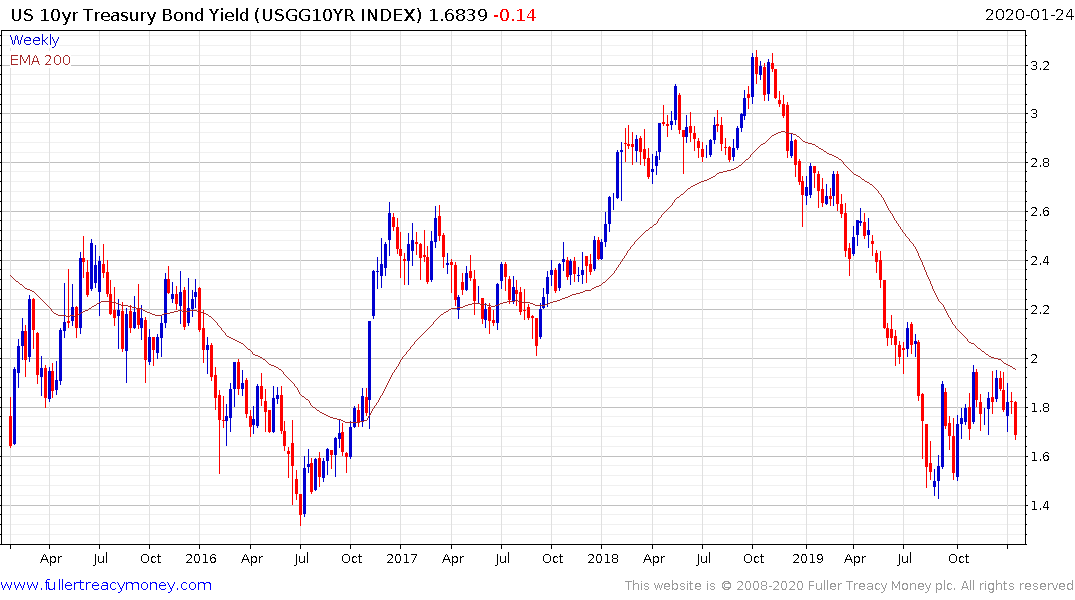
10-year yields moved to a new reaction low today and a clear upward dynamic will be required to question renewed demand dominance.
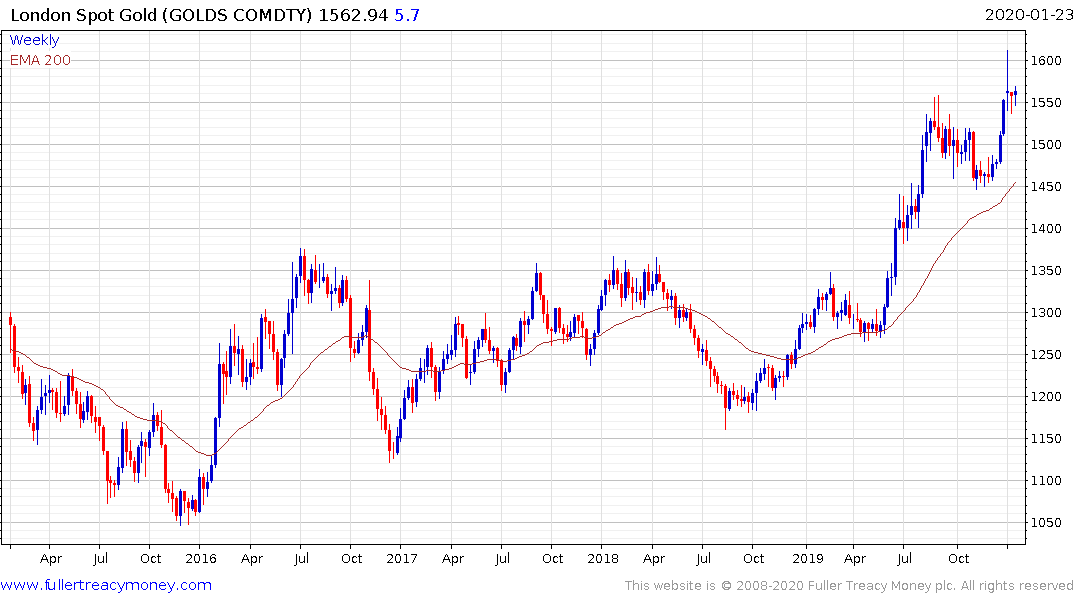
Gold continues to firm from the $1550 area, which also represents the peak reached back in August/September. While an overextension relative to the trend mean is still evident there is still potential for additional upside if the news flow deteriorates.
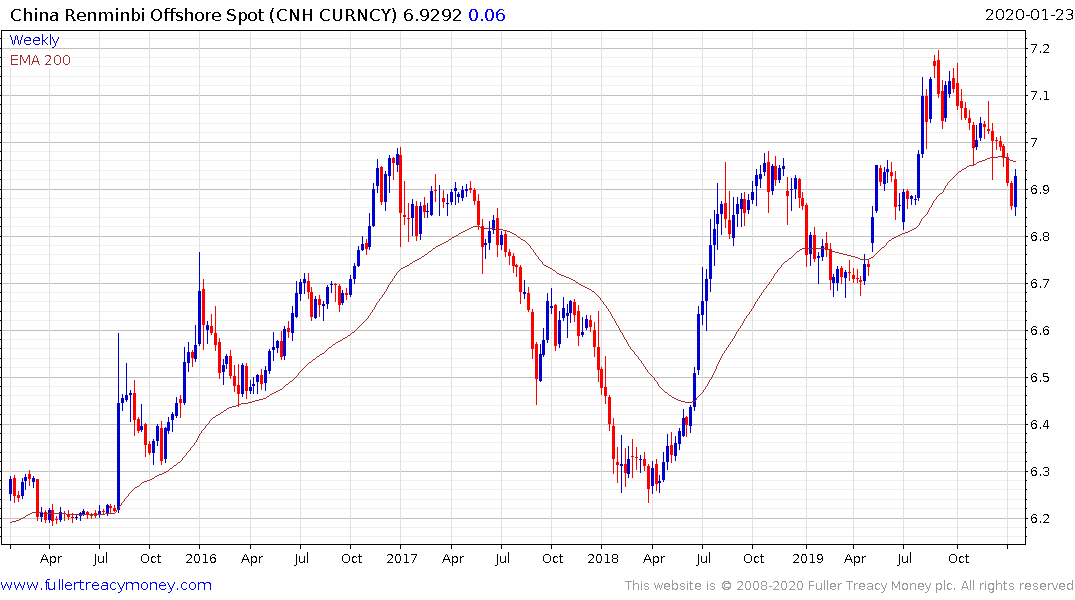
The US Dollar posted an upside weekly key reversal against the Offshore Renminbi this week. With the markets shut for the Chinese New Year holiday next week, there is scope for some volatility in the rate as traders arbitrage the risks posed by widening quarantines on the domestic Chinese economy.
Meanwhile the total assets of central banks chart is sensitive to Dollar strength and contracted this week from the peak near $20 trillion.
2017 was the last time we had anything approaching the central bank fuelled rally seen since the repo crisis in September. Back then central bank total assets increased by a little more $3 trillion in a year and contributed to a more than yearlong rally where volatility was almost completely absent. The number of times the VIX Index traded below 10 were almost all posted in 2017 because of this monetary splurge.
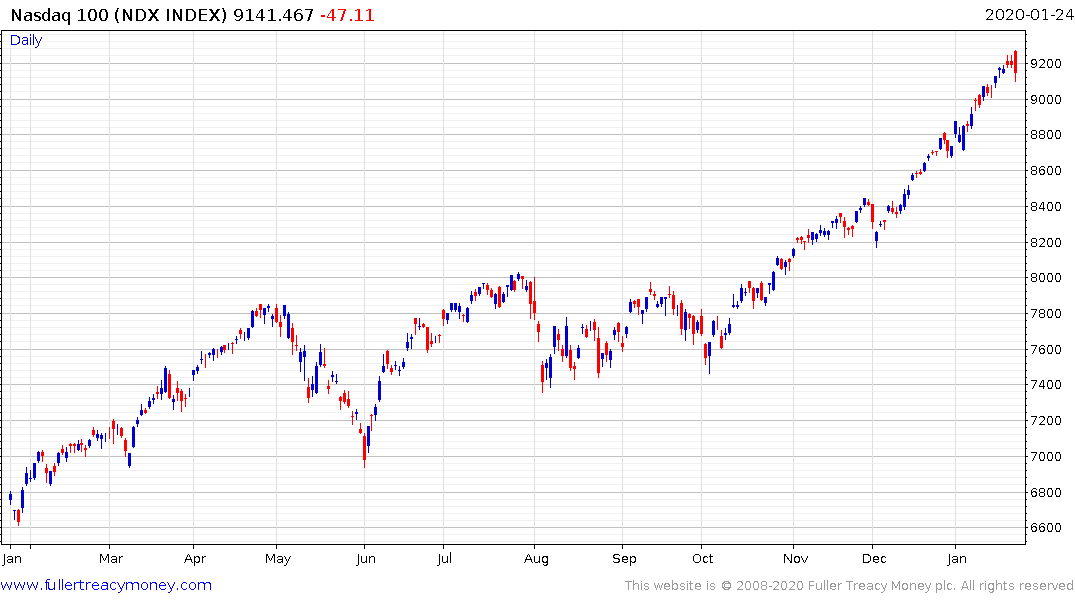
The similarity in the persistence of the move since October and the $750 billion added to central bank balance sheets is hardly a coincidence. The Nasdaq-100 just about squeezed a downside key day reversal today. Downside follow through next week would confirm a peak of near-term significance. Short-term overbought conditions are evident and there is scope for consolidation. The bigger determinant of whether the breakouts hold is likely to be dependent on continued liquidity provision.