
Fed plan to reverse QE is fraught with danger
This article by Ambrose Evans-Pritchard for The Telegraph must have touched a nerve among investors because I received multiple emails asking about it. Here is a section:
It typically takes about 500 basis points of Fed cuts to fight bad recessions. It was even worse after the Lehman crash in 2008. The Fed ran out of ammunition after 475 points and had to flood the system with liquidity through QE. The total was, in synthetic terms, 850 points of loosening.
As matters now stand, the Fed has just 100 basis points of cuts to play with in a crisis. Prof Blanchflower said: “We should be getting as far away as possible from the zero-lower-bound [zero rates] before selling off any assets, otherwise we are going to have a disaster.”
What makes this so sensitive is that the window for QE in the future is closing. The two new Fed members floated by the Trump administration, Randal Quarles and Marvin Goodfriend, are both staunch conservatives hostile to QE. The bar will be higher. This means the Fed may have to fight the next downturn with little in the arsenal.
It is going to be pretty unpleasant if we hit a crisis with only four rate cuts to play with and no QE.
One ex-Fed official said: “It is going to be pretty unpleasant if we hit a crisis with only four rate cuts to play with and no QE. The whole universe of asset prices is built on the assumption there will always be a ‘Fed put’ and bond yields will never be allowed to rise.”
Professor Tim Congdon, founder of the Institute of International Monetary Research, said quantitative tightening would compound the monetary squeeze just as big banks were already having to boost their loss-absorbing capital to 16pc of risk-weighted assets under the Basel rules.

Here is a link to the full article.
The logical conclusion is that if monetary accommodation contributed to asset price inflation then removal of accommodation should represent a headwind. The Fed is betting inflation and growth will pick up enough to compensate for the impact of the shrinking of its balance sheet. I agree it’s a big bet and I discuss the issue in most big picture Friday audios.
However I disagree that shrinking the balance sheet is unnecessary. There is a wall of debt that needs to be refinanced starting next year. To be more accurate $360 billion in Treasuries, $200 billion in bonds and leveraged loans and $150 billion in high yield debt need to be refinanced next year and that figure ramps up in subsequent years. The figures for 2019 are $325 billion in Treasuries, $300 billion in bonds and loans and $350 billion in high yield. For 2020 it is $225 in Treasuries, $400 billion in bonds and loans and $350 billion in high yield.
In summary that is $710 billion in 2018, $975 billion in 2019 and another $975 billion in 2020. If the Fed wants to try and re-arm the interest rate gun and do anything about the size of its balance sheet it has a window now that might not be open in coming years. (Check out slides 46-48 on this report from DoubleLine dated December 2014.)
Argentina sold a 100-year bond yesterday and it was three times oversubscribed so there is still ample demand for yield. The bond markets are much larger than the stock markets but upwards of $3 trillion to be refinanced in a 3-year period holds out the risk the market could experience indigestion. For the sake of comparison the total up for refinancing this year is less than $500 billion and even that is a multiple of what needed to be refinanced last year.
Personally I am keeping a close eye on a number of indices.
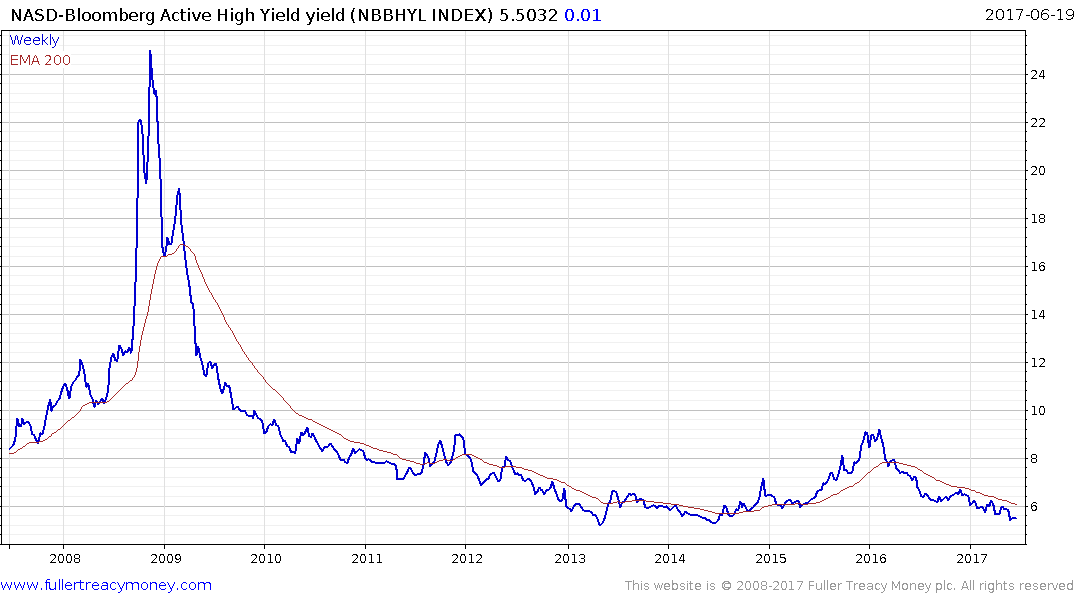
The NASD Bloomberg Active High Yield Index blew out to 9% in early 2016 but has since held a progression of lower rally highs and is back testing the lows last seen in 2013 near 5.35%. A break in that 18-month downtrend would signal investors are beginning to price more risk into that portion of the bond market.
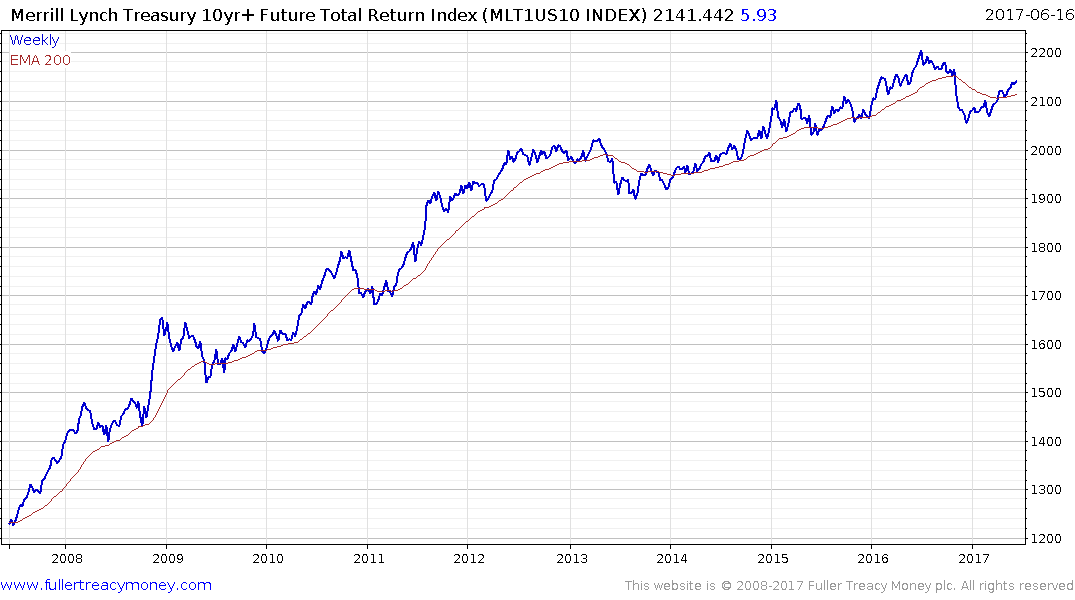
The Merrill Lynch Treasury 10yr+ Futures Total Return Index pulled back sharply last year but has held a progression of higher reaction lows so far this year. A break back below the trend mean would be required to signal a return to supply dominance.
.png)
The 10yr-2yr US Treasury yield curve spread is contracting and currently stands at 83 basis points; down from 250 in 2014. If the trend of compression continues we will possibly see an inverted yield curve at some point in 2018. That has been a reliable harbinger of recessions over the last century with anything from a 6 to 18-month lead.
The question most subscribers have asked is whether it is now time to lighten equity holds or possibly to stop buying.
I think it is clear that there are medium-term risks in the bond market but it is rallying right now. It is not an exaggeration that liquidity is a like a drug for markets and they are priced as if the flow will persist indefinitely. However the above charts do not yet signal a change of trade. If we ask ourselves the simple question “Is there any evidence of trend ending in the bond yield charts. The answer is no for three and maybe later for the yield curve spread.
Right now stock markets are somewhat overextended relative to their trend means and are due some consolidation and at least some rotation. I am short the Nasdaq-100 with a breakeven stop and expect a reversion towards the mean. Considering we could be upwards of two years away from a recession I think it is too early to worry about a major top just yet.
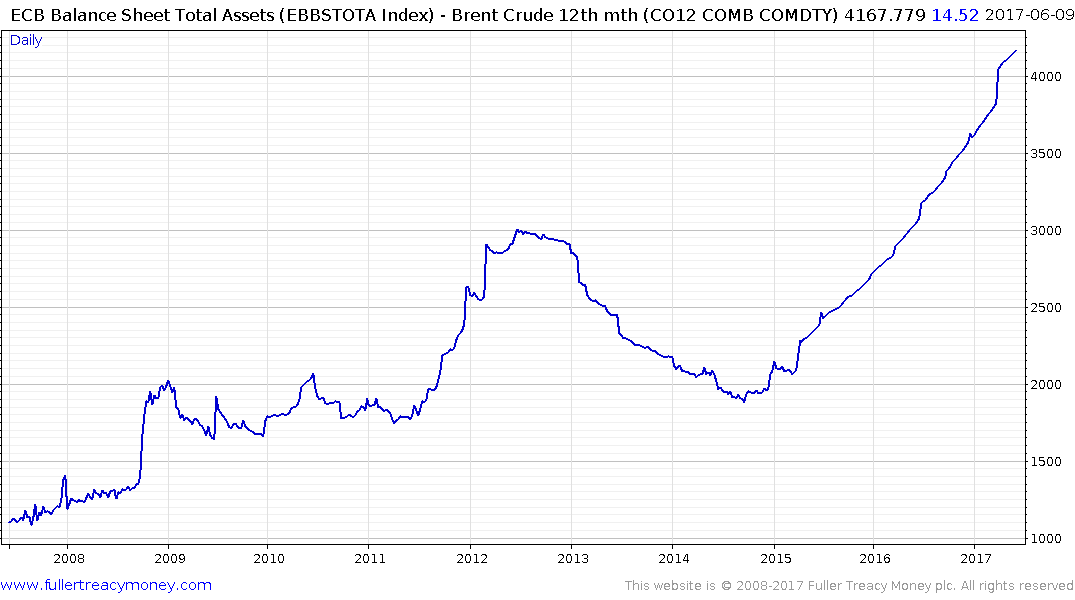
If the ECB’s experience with shrinking its balance sheet is any guide, the experiment failed and they had to adopt even more aggressive stimulus subsequently. That is not beyond the bounds of possibility on this occasion either.