
Email of the day on what pundits are saying
Lowry's, the oldest TA firm in the business, is telling it's (mainly institutional and family) clients that any further weakness warrants moving to a fully defensive posture, selling all non-defensive equities. They are calling this a bear market with the potential to go to 2040 as a last hurrah.
Leithold told it's (similar) clients on Friday to sell down to a 30% invested level - sounded like they are keeping the highest dividend defensives, if I understood right.
David Rosenberg is still pretty bullish, arguing that US and North American economics except commodities are still good.
Jim Cramer gave his audience a pretty long list of stuff to sell today (autos, commodity companies, gpro, ge, dd, railroads except UNP. Cramer likes AAPL, FB, AMZN, NFLX, GOOGL.
How quickly sentiment can shift...
CNBC anchors are still cheerleading for the Fed to come to the rescue. Each new day is a new day of hope for same.
Larry McMillan turned intermediate-term bearish when the market broke 2040.
Of course the Elliott Wave guys are now predicting that this will be the biggest bear market since 1929 (hmm, have they said that before?)...
John Murphy (who seems to use indicators and classic TA patterns a lot (wrote books on same), but seems to rely on EW for longer-term stuff) says:
"Stocks have entered wave 4 correction -- 2015 downturn closely matches 2011 Correction which bottomed in October – to keep the long-term uptrend intact, last October’s lows have to hold – VIX index surges to new 2015 high."
The Fast Money traders on CNBC are split with 1 bull who said yesterday "I guarantee the bottom is in", 3 bears and 1 bearish-wait-and-see-where-it-goes.
And with that, we'll wrap up the sentiment-influencers report.

Thank you for this summary of what various analysts and pundits are saying. It’s quite a range of opinions but perhaps the most important takeaway is that market action has forced people to announce an opinion and big calls receive a lot of attention in a competitive media environment. Let’s split the market down into short, medium and long-term chart facts.
.png)
Long-term, the S&P500 completed a 13-year range in 2013 and this pullback is the largest since that momentous event. Secular bull markets don’t play out overnight and previous secular bulls on Wall Street have persisted for upwards of two decades. China and the fate of emerging markets is currently animating media discussions but the really big question is how much of the rally from the 2009 low was predicated on the Fed’s loose monetary policies.
Let’s ask ourselves is it possible to retest the upper side of a trading range following a big breakout. The answer is yes. A previous area of resistance can definitely become a future area of support.
Next, is this really a secular bull market? Considering technological innovation, the energy revolution and rising global middle class, I believe it is and nothing has happened to question that view. Therefore the upper side of the underlying range in the 1550 to 1600 area represents a worst case scenario provided the secular bull market hypothesis is correct.
.png)
Medium-term, the cyclical bull market from the 2009 low became progressively more consistent as it matured. This is what we expect from a bull market as the imbalance between supply and demand becomes more pronounced. The aggressive pullback in October was an inconsistency but was retraced so quickly that investors were tempted into believing that it was an anomaly. In the Chart Seminar we discuss how common it is for a trend which has become progressively more consistent to lose consistency at a penultimate high.
This is the largest pullback since 2011 but prices are almost double today what they were then. I’ve described this as Type-2 top formation completion since it is a massive reaction against the prevailing trend by definition. The question is how the subsequent market will play out and it would not be unusual for a ranging phase to take place as market participants debate what has really changed. That range has the potential to get back up to test the region of the 200-day, near 2040, or it could be shallower. The really big medium-term question is whether the Index is now capable of sustaining a move back above the 200-day MA? Considering the extent of technical deterioration that is looking unlikely without some significant time spent rebuilding support.
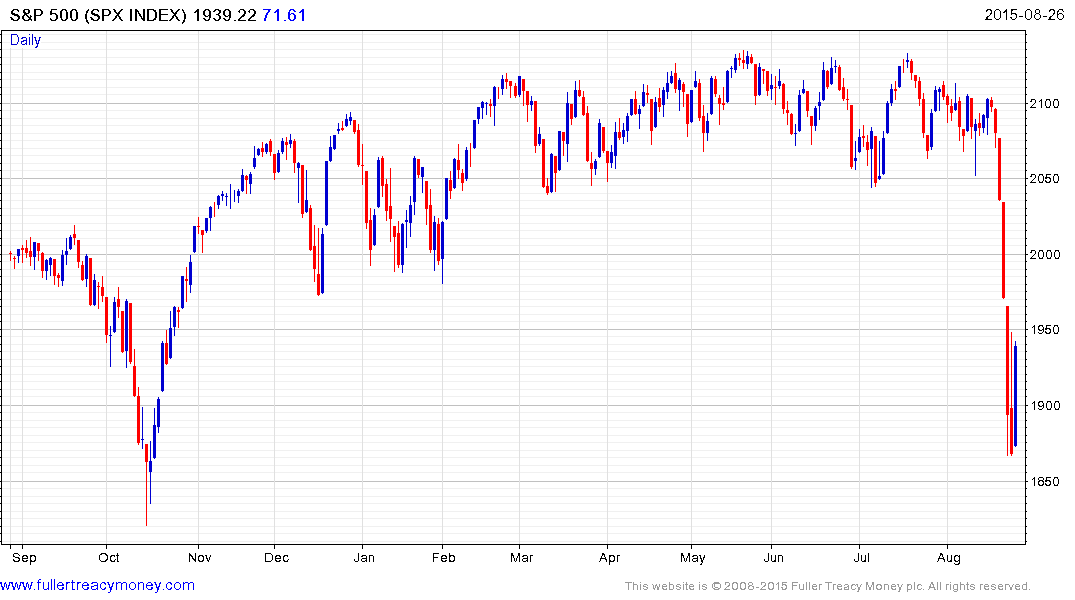
Short-term the market traded in a tight range between February and last week before falling aggressively. It has steadied in the region of the October low and today’s action is more supportive of the idea that a relief rally is underway.
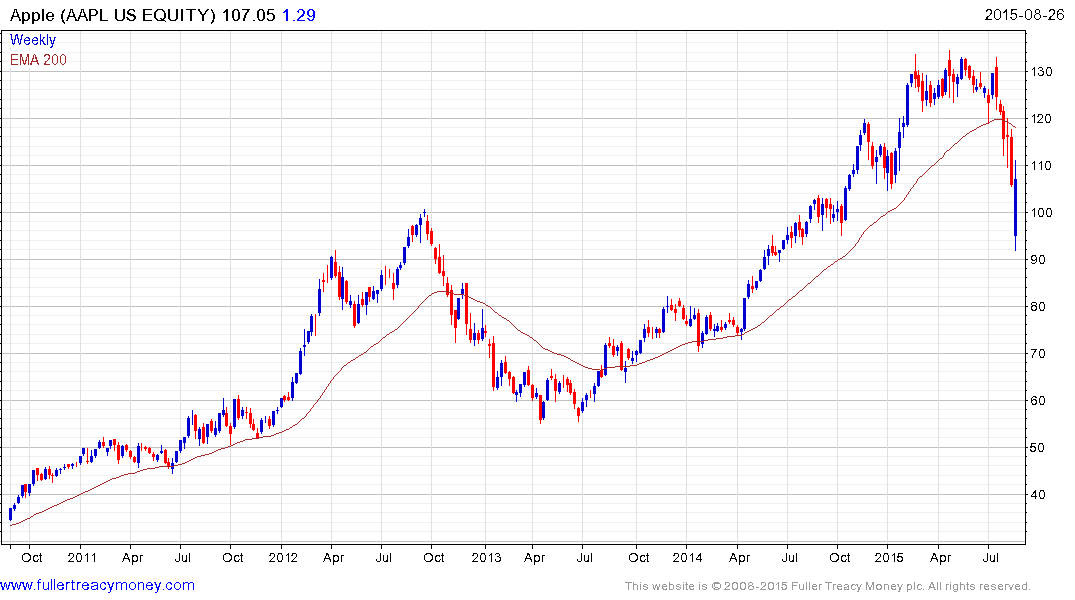
I posted a number of charts on Monday for previous momentum leaders which had returned to test their respective 200-day MAs and were bouncing. Netflix, Google, Starbucks, Amazon and Nike were all on that list and I should have added Apple which has some of the best valuations of any major share. Under Armour has also found support in the region of its MA. This helps to illustrate that despite the taut environment there are clear relative strength leaders and while it would be unreasonable to expect moves to new highs right now, they have offered some of the best safe havens of any asset.
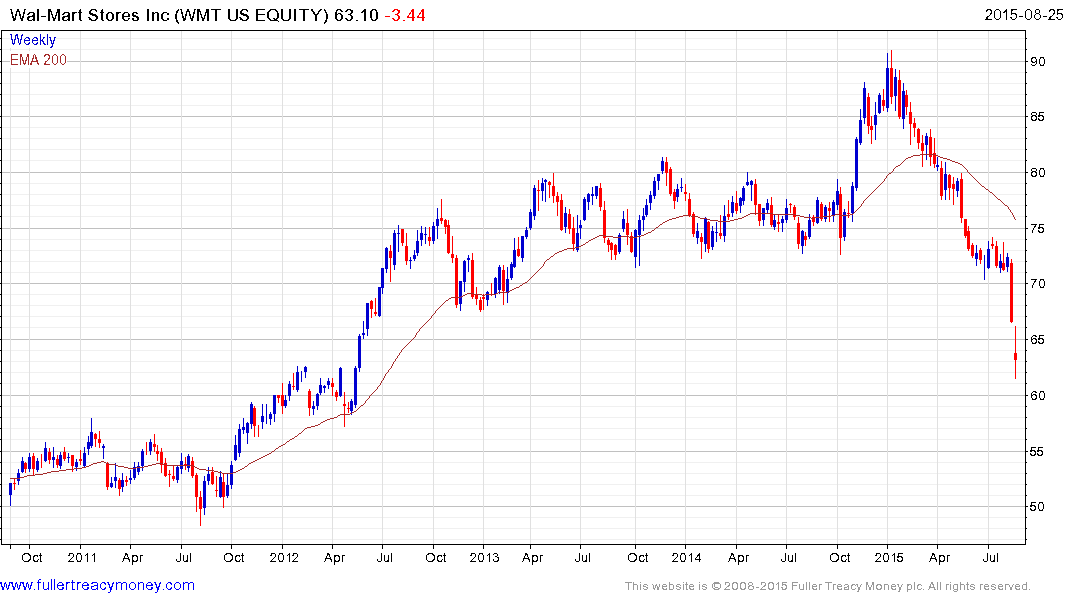
Among some of the more oversold shares Wal-Mart with a P/E of 13 and 3% yield is not expensive as we enter the ramp up to the fourth quarter’s holiday season.