
Email of the day on volume at major peaks and troughs
I hope this email finds you and yours in fine spirits, especially ahead of your holiday in China. In August 1982 it was pointed out to me that the Dow Jones had undergone its largest volume in transactions ever. The argument was that people had held on and held on in the hope that something would change, remembering that the Dow had traded sideways, basically between 1000 and 500 for 16 years, since the 1966 peak. That those who sold had given up the ghost and those who bought were a whole new generation of optimists. Obviously, the new generation where proved correct, as apart from a minor hiccup in 1987 the market went on a secular bull market until the year 2000.
Since that time, I have always used market volume indicators, both for stock markets and individual share prices as short and medium-term indicators of sentiment and any change therein. During today’s check through my favourite charts I noticed that 3 weeks ago the Russel 2000 and the DJ Wilshire 5000 float had their largest volume spikes in at least 5 years.
I was using your weekly charts. Do you think we might be entering a similar change in sentiment which seems to be encapsulating the majority of global stock markets at the moment? FYI global stock market trading peaks gave me the confidence to increase my equity exposure in 2003 and 2009. Personally, I do not think that volume spikes at a low or a high are coincidence, but indicate a change of investor sentiment in this ever-intriguing global market

Thank you for this interesting observation and I agree that spikes in volume, particularly following accelerations can be indicators a panicky buying or selling.
However, I think it is important to think of volume as part of a range of tools rather to rely on it completely. First, volume data tends to be revised and in the USA block trades don’t have to be reported for upwards of three days. Additionally, a lot of trading now takes place off exchange in dark pools so it is reasonable to query how efficacious the data is.
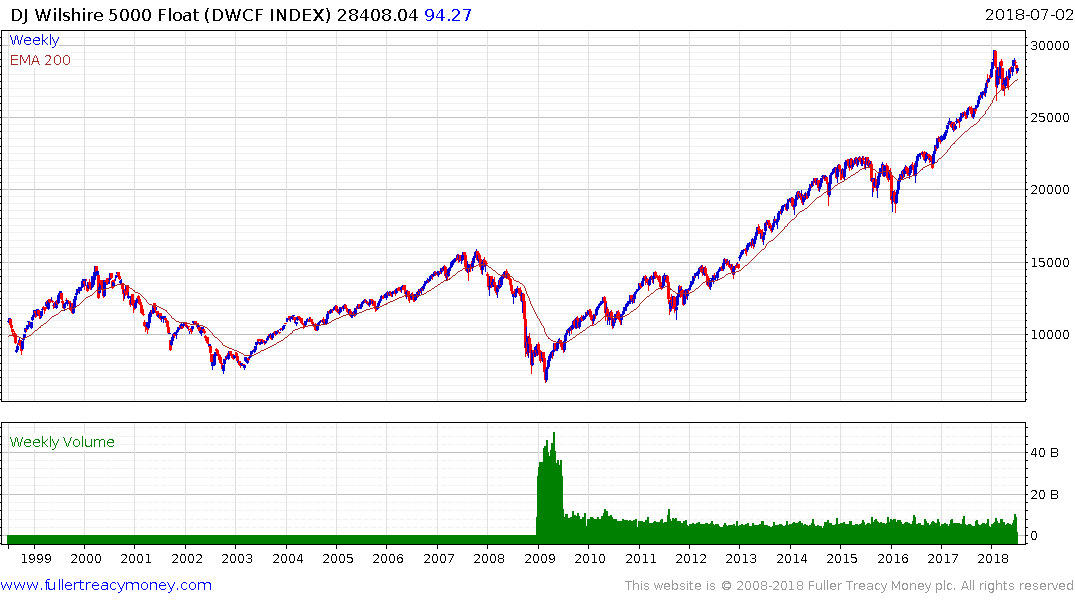
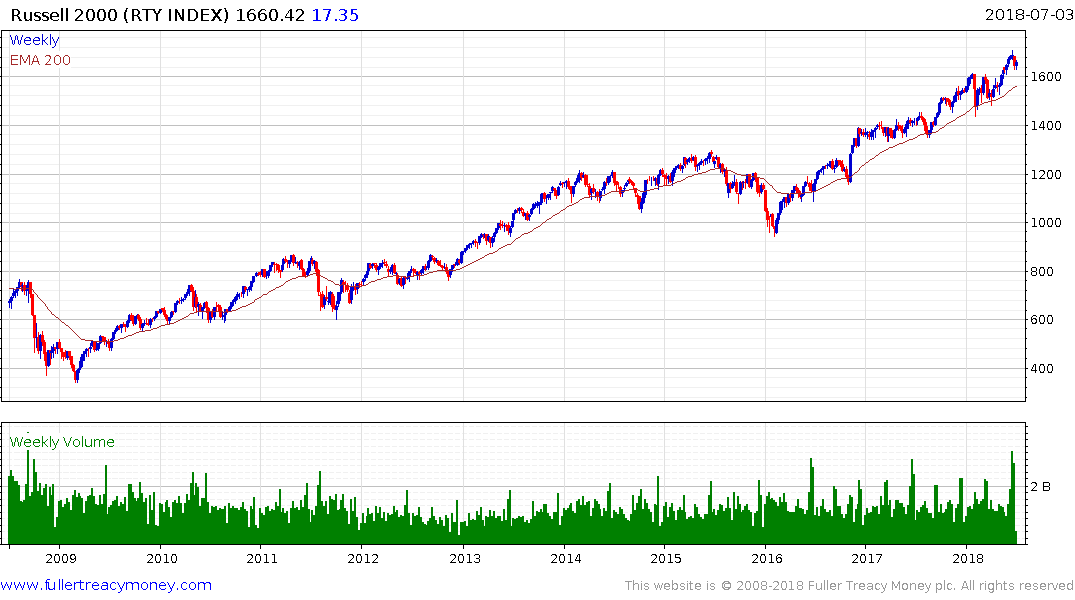
If we look at the volume charts for the Wilshire 5000 and the Russell 2000 we can see that the volume was somewhat higher, but not meaningfully so, over the last couple of weeks. Perhaps that is a reflection of the fact this market is not quite ready to support a breakout to new highs.
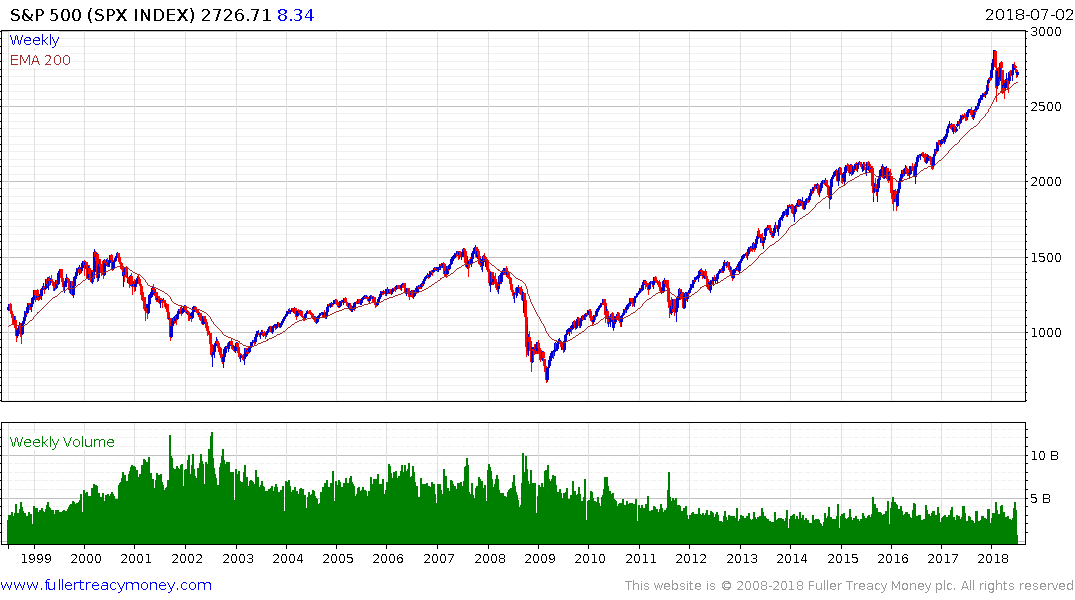
What I find more interesting is the declining volume on the S&P500 which has been trending lower for years. When that eventually spikes on the upside it is likely to be a more reliable indicator of a change of sentiment, at least in my view.
The volume chart on platinum is also worth mentioning because volume evaporates at the contract rolls which often represent turning points for the price. Yesterday’s climactic selling and today’s rebound suggest a low of at least near-term and potentially medium-term significance has been reached.