
Email of the day on the yield curve spread and medium-term outlook for bonds
I just have a couple of queries for you:
Where can I find the US yield curve spread chart (10yY-2yY) in your chart library?
Based on expected MT to LT yield rising environment, should I keep my PIMCO income Fund (Global Investor Series Plc), or dispose of it?
Thank you and best regards

Thank you for these questions which may be of interest to other subscribers. I created this video to discuss both how to create the chart and save it as a preset template for when you want to find it later which I hope will be of use to you. https://vimeo.com/217618153
As for whether to continue holding your long in the Pimco fund I am not in a position to give you advice. However, if we address the chart facts perhaps you can come to your own conclusion.
The Fund is now trading below the trend mean. This is not the first time. On previous occasions pullbacks below the mean have been buying opportunities. Therefore, to confirm a top the NAV will need to encounter resistance in the region of the trend mean and sustain a move to new reaction lows which would signal a downtrend is in evidence.
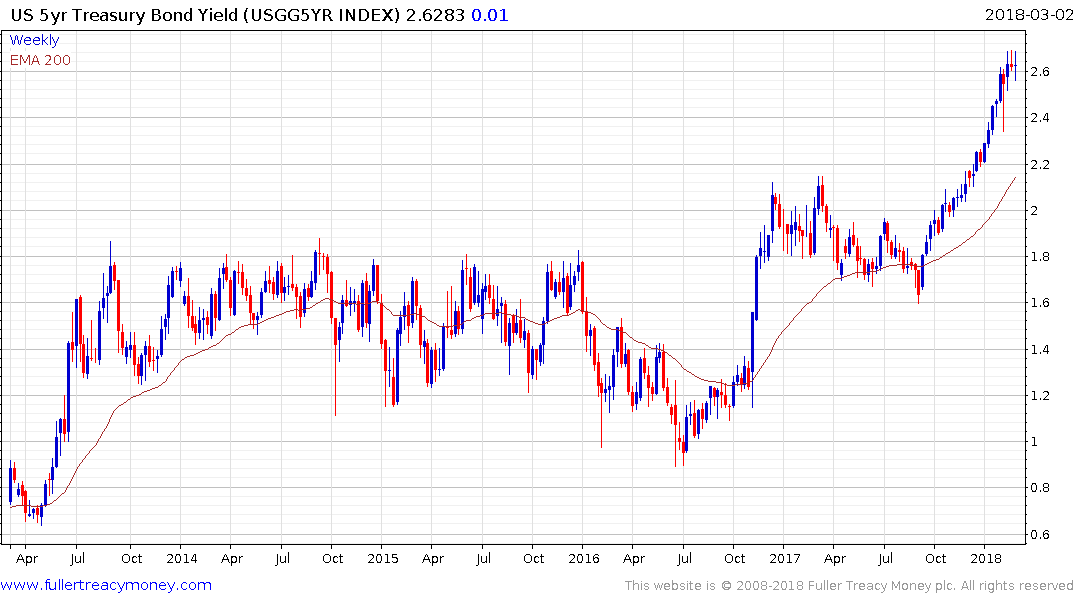
A great deal of debt is being issued at 5-year maturities and that yield remains on a steep upward trajectory as scale of that issuance continues to be priced in.
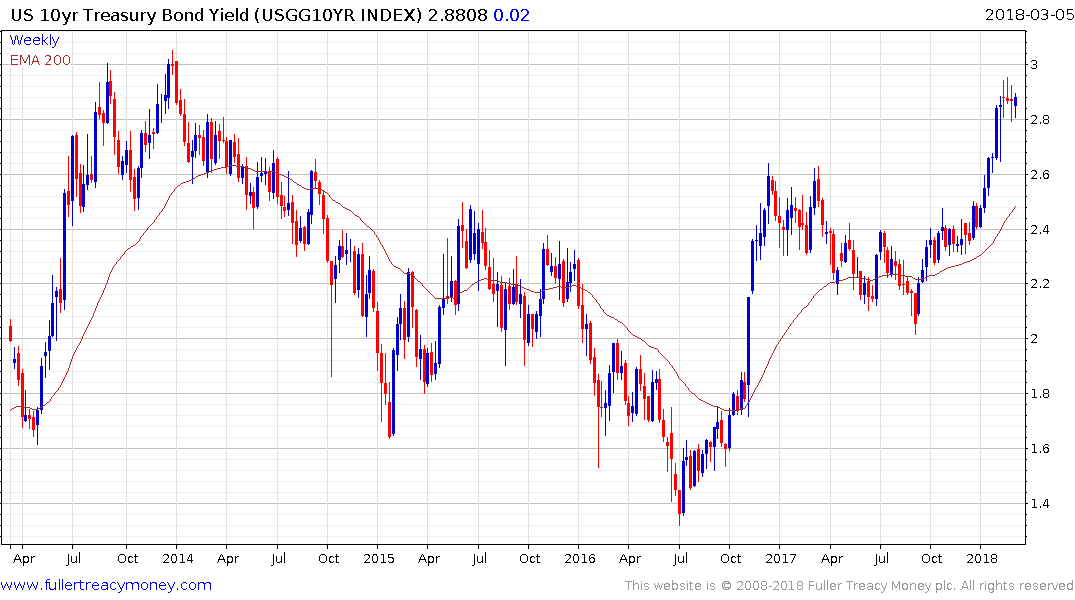
Meanwhile 10-year yields continue to pause below 3% and a sustained move below 2.8% would be required to question potential for additional upside.