
Email of the day on the Dow Jones Industrials outperformance
You already commented a bit on the state of the US stock market yesterday (October 17). But I want to share with you FT story on similarities and differences between today's market and the one 30 years ago, "How big is the risk of another Black Monday equities crash?"- While reading it, I looked at Dow Jones chart. It is not visible on 1- or 2- or even 3-year charts, but 5- and 10-year ones show rather obvious acceleration this year, don't they? What do you think?

Thanks for this question which others may have an interest in. The Dow Jones Industrials Average has been among the best performing indices globally this year and has been led higher by shares like Boeing, Caterpillar, Visa and McDonald’s, while General Electric has been a notable underperformer.
Here are two charts of the Index, a candle chart and a point and figure chart
.png)
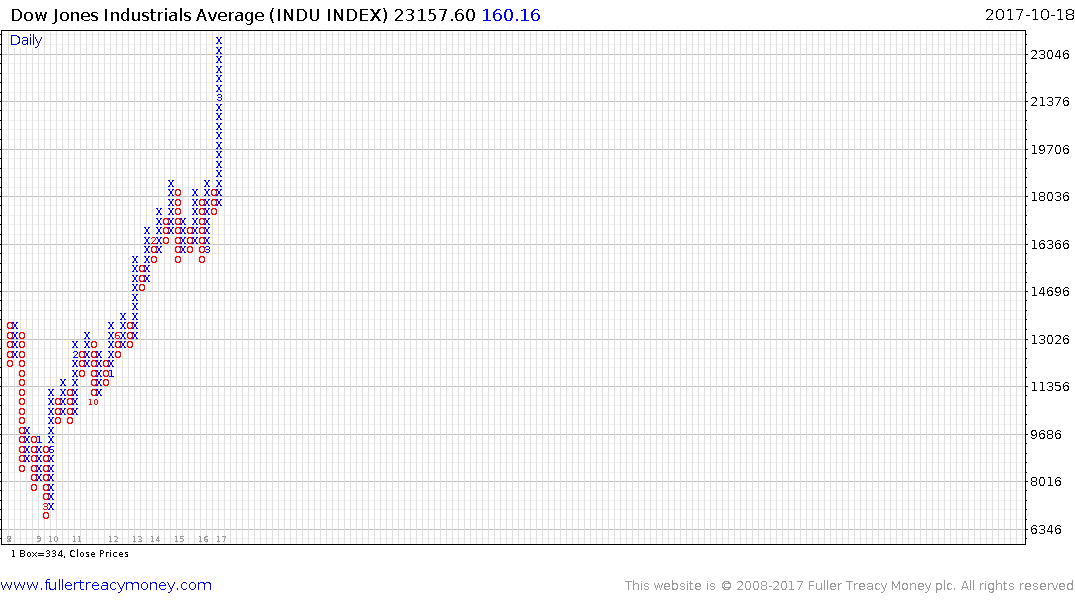
Any way we look at it we can easily observe that this year has delivered a much more consistent advance than any in the context of the bull market that began in 2009. That reflects a clear acceptance by investors of the bull market hypothesis. From the perspective of a behavioural technical analyst, and after all that is what this service is dedicated to, there is an important filter question we should ask:
“Is this still a consistent trend?” We have certainly seen the pace of advance pick up, so if this year’s pattern of consolidation and breakout is to continue we are due a consolidation. If we do not get one soon, then we can reasonably conclude the market is accelerating and that is a trend ending but of indeterminate duration. It does however increase the potential for a reversion towards the mean which right now would be a pullback of approximately 8.5%. That also helps to highlight that even though we have seen an impressive advance it is still only modestly overextended relative to the trend mean.
How about is there are evidence of Type-1,2 or 3 trend endings? We could see an acceleration if we don’t see a consolidation soon but there is no evidence of Type-2 or 3 right now.
.png)
A Type-2 top is characterised by a massive reaction against the prevailing trend. We have ample examples of this from 2007 when somewhat longer ranges were concluded by emphatic breakdowns below the trend mean. We don’t see that set up right now either.
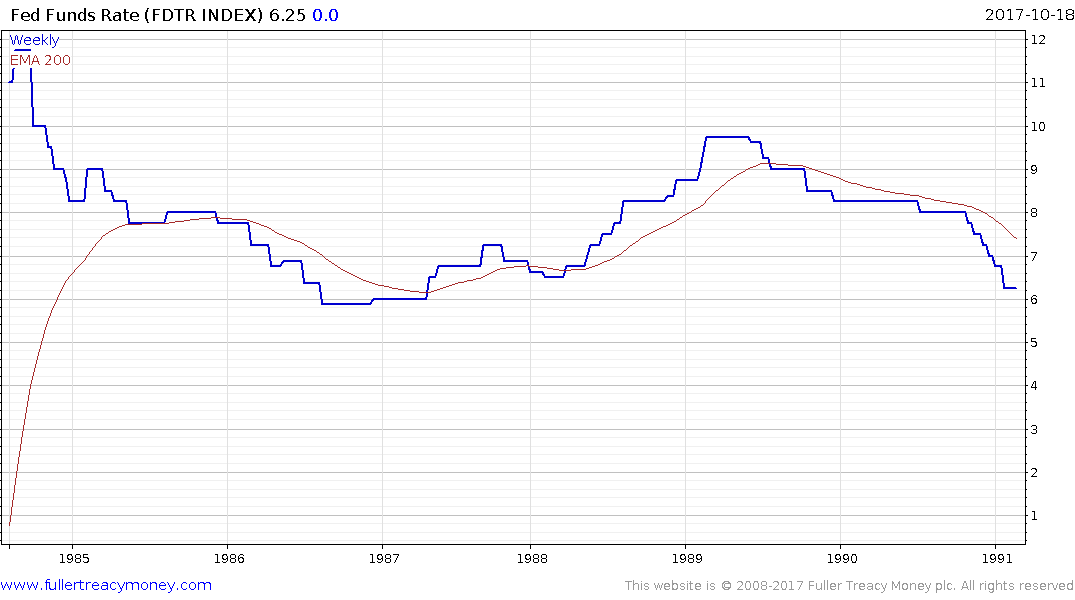
This week marked the 30-year anniversary of Black Monday so the media has been flooded with stories making comparisons. The big question from my perspective is not whether there are accurate comparisons between now and 1987 but rather whether a crash is imminent. Now, as then, interest rates have risen modestly off their lows, although back then the move was from 5.9% to 7.25% and buy-the-dip is certainly prevalent. There is also an increasingly heavy reliance on risk parity and quantitative strategies.
This article by Matt Maley for CNBC highlights the fact that the proposal of a takeover tax was a catalyising factor for profit taking ahead of the crash in 1987. Here is a section:
Some might say you could blame the whole crash on Dan Rostenkowski. OK, before you get all worked up, I don't really blame the crash on Rostenkowski, who chaired the House Ways and Means Committee at the time and had spent many years on the tax-writing committee. But Rostenkowski and his committee played a very, very important role in the crash of 1987.
In fact, it was that committee's "trial balloon" regarding a takeover-tax bill, sent around several days before the crash to see how the measure would be received, that was a main catalyst — or at least the straw that broke the camel's back — in an environment that was already appearing to be a perfect storm for some kind of tumble for months, if not years.
Just as then we have a major tax question hanging over the market and as Steve Mnuchin has highlighted if it fails there it could prove a catalyst for profit taking. By the same token if it passes, so much good news has already been priced in that it could still result in a pullback.
In the meantime, the other major issues that could disrupt the buy-the-dips strategy deployed by quantitative strategies would be even higher interest rates and/or the removal of liquidity through proposed central bank balance sheet rationalisation.