
Email of the day on stretched valuations
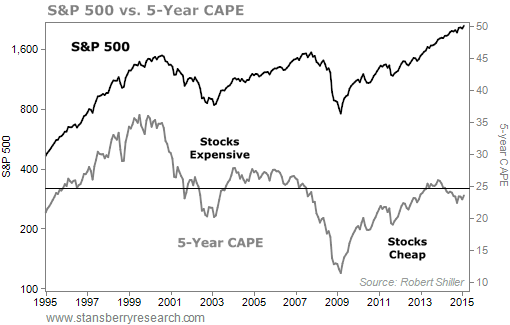
Regarding yesterday’s comment ‘are US valuations stretched’, I came across an interesting analysis on the web. One commentator pointed out that investors focus on the 10 year CAPE (cyclically adjusted PE) made popular by Robert Shiller to suggest valuations are high, based on a supposed view of Benjamin Graham that this is a good measure. But the author went back to the original source (Graham’s book, Security Analysis) and quoted Graham’s actual wording. He wrote that you want to use "the average earnings of a period between five and 10 years." If one uses a 5 year period to calculate CAPE, then the S&P 500 does not look stretched:
Why such a big difference? CAPE is based on the Price to Earnings ratio, and the ratio depends on both price and earnings. In 2009 earnings collapsed and ‘E’ was artificially low. That very low figure will distort calculation of 10 year CAPE until end 2018. In 2019 CAPE will ‘suddenly’ fall! Do you think that ignoring CAPE calculations that include 2009 earnings may give a truer reflection of the valuation of the US market?

Thank you for this thought provoking email. You will remember that there was a great deal of talk in the financial media about the elevated CAPE towards the end of last year with some commentators highlighting that it was a signal of a maturing market but not a timing indicator. Parsing financial data is not where we focus our attention because we do not see that as our particular strength. However I agree that depending solely on a long-term metric that has been the subject of a massive dislocation leaves one susceptible to exiting the market much too soon.
.gif)
This chart of the S&P 500’s P/E ratio over the last 50 years highlights the generational long process of P/E ratio expansion and contraction that one associates with major bull and bear markets. The calculation is subject to spikes for exactly the reasons you point out. What I believe is quite clear is that despite the interruption of the credit crisis, the process of multiple contraction that began in 1999 ended in 2010. Considering the long-term nature of the chart we might conclude that we are still in the early stages of a secular expansion and that the trend will inevitably be punctuated by some violent dislocations.
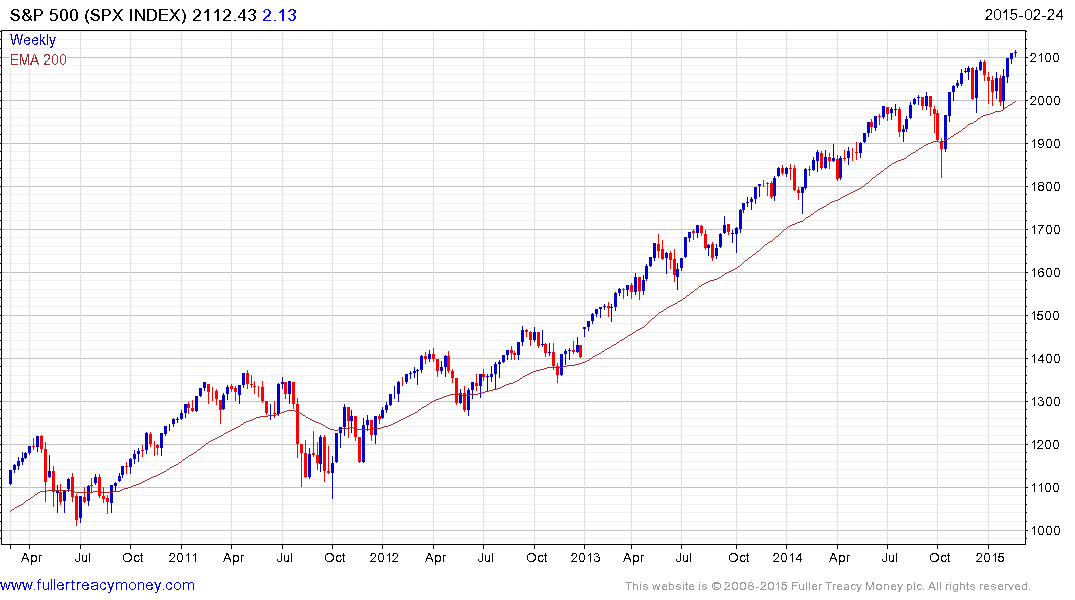
It is normal for markets to overshoot and stock market trends remain in motion. At The Chart Seminar, when presented with a consistent trend we next ask the question “Is there evidence of Type 1,2 or 3 trend ending characteristics?” At the present time the answer is no and therefore we give the benefit of the doubt to the upside.
Back to top