
Email of the day on my central bank total assets chart:
You have mentioned that the graph showing central bank assets is one of the most important. Consequently, I wondered how the fact that they are reducing this tied in with your moderately optimistic views on the stock market. Do you think the US Fed Reserve will continue to reduce its balance sheet given recent market turmoil?

Thank you for this question which I believe is of general interest and is something I have also been pondering. There are two reasons the chart has been contracting since March. The first is because the Federal Reserve is reducing the size of its balance sheet and other central banks are reducing infusions. The second is the strength of the Dollar has flattered the contraction by reducing the relative value of other currencies held on global central bank balance sheets.
To first answer your question. I think it is likely the Federal Reserve is going to pause or at least moderate the pace of interest rate hikes but it will continue with its balance sheet reduction exercise.
That action has the additional effect of reducing the quantity of Dollars in circulation. That’s one of the primary reasons I don’t agree with so many other analysts who are predicting the imminent decline of the Dollar. If supply is falling against a background where demand is rising, not least from all those Dollar bond issuers, then it is hard to support the medium-term bear hypothesis currently being pushed.
We might consider that the big macro picture and we know it takes time for the monetary policy to wend its way into the economy and pricing. As I pointed out Friday, the TIPS curve inverted six months ago and is generally an even longer lead indicator than the classic 10-2-year spread. An additional point is stock markets often continue to rally for months after the inversion because people always doubt its predicative power because the lead time is so long.
We are at an interesting stage in the market profile because either the Fed is going to pause and the market gets enthusiastic about valuations and we go into a bubble phase, or this range persists for longer and the earnings outlook deteriorates which would raise valuations and contribute to top formation. Ranges are explosions waiting to happen.
Right now, a short covering rally is underway not least because a great deal of bearish news was priced in during October and valuations are back where they were before the US Presidential election in 2016.
A major rotation has been underway, out of semiconductors and mega-cap tech and into cash flow generative businesses with strong records of dividend increases. The former are now bouncing, to at least unwind oversold conditions relative to their trend means.
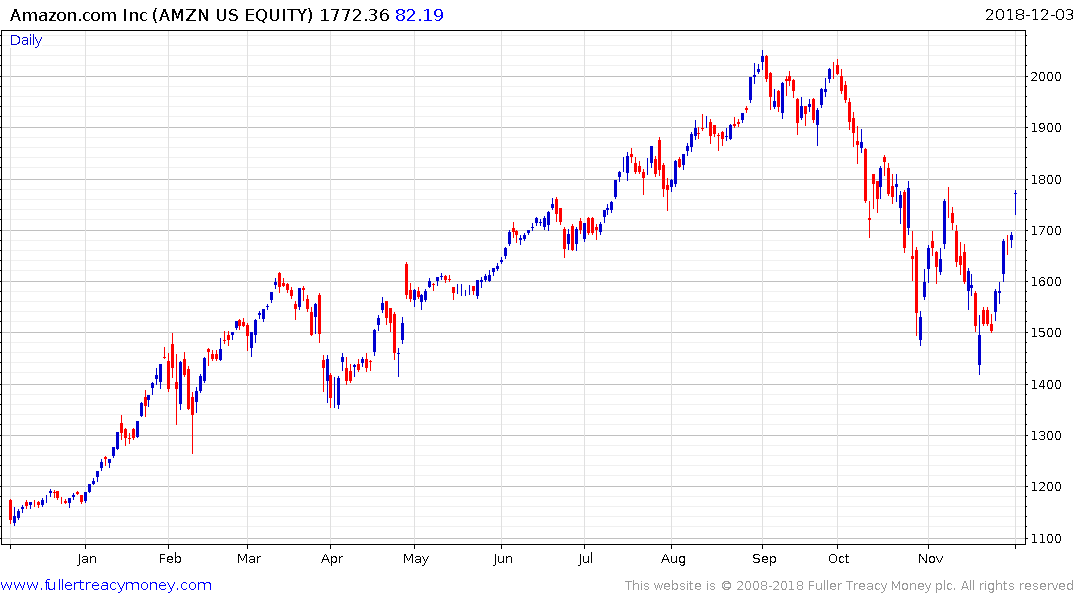
Importantly, Amazon is now testing the region of its November high and has replaced a short-term oversold condition with an short-term overbought condition. It needs to put in a higher reaction low to confirm a return to demand dominance beyond a bounce.