
Email of the day on moving average calculations
Good afternoon, I am a long-time subscriber to your wonderful website and just have a question regarding the chart library.
I was looking at the moving averages on daily, weekly and monthly charts in your library, and noticed that when comparing to other chart terminals like Bloomberg or sites such as StockCharts, the MA values for weekly and monthly charts don't appear to match despite the same values being inputted. As an example, I attach the weekly charts for S&P500 with the MA values of 34, 89 and 200. Interestingly, the daily charts do have MAs matching.
I was wondering what would be the cause of this discrepancy, perhaps a different formula or method for calculating the MA? I like the way that your chart library appears to calculate the MAs, so if this is indeed the case, is there a way to use the same method for calculating the MA on, say, a Bloomberg terminal?
Thank you in advance and I look forward to hearing from you.

Thank you for this question which comes up from time to time. The discrepancy is easy to explain. We calculate moving averages on a daily basis because we include all the data at our disposal. Other chart systems calculate the moving average based on the data displayed.
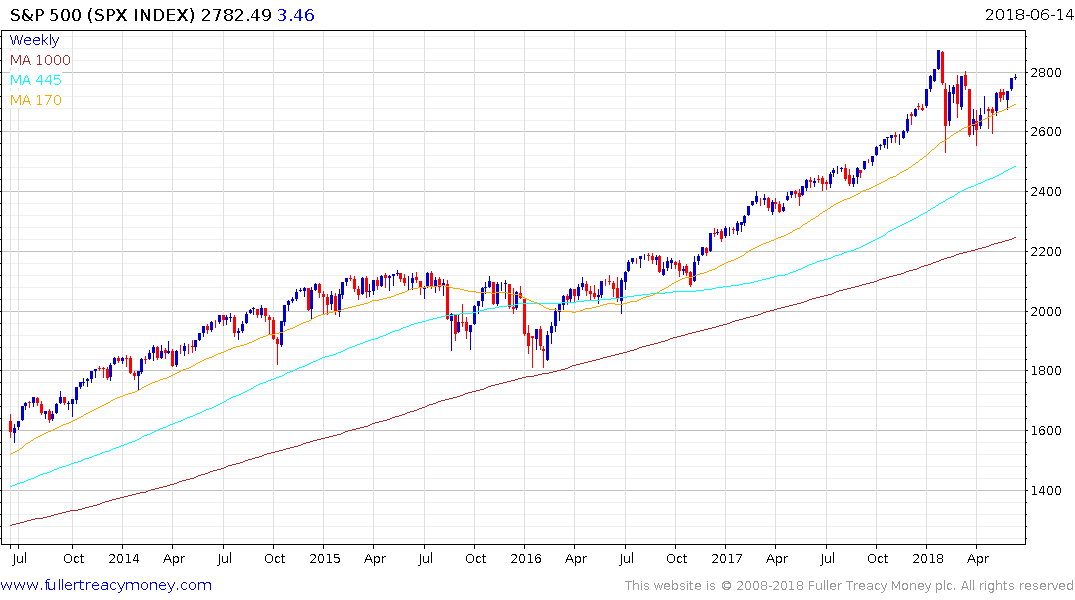
Therefore, when you look at a chart in our Chart Library you can switch between monthly, weekly and daily without changing the settings and will always have the value represented. Since there are generally five trading days to a week, 200 days is equivalent to 40 weeks on another service, or 12 months and so on.
.png)
.png)
By multiplying up the values from your chart I created this chart although personally I would be inclined to use a longer-term chart when using longer-term moving averages.