
Email of the day on moving average calculations
Not that there isn’t anything else to consider today, but I would appreciate more information on moving averages as discussed in the audio. I realize there are several types that can be applied and they present different results.
Is there a standard across the board we should apply or is one appropriate for a type of chart and time period and not for another? I just want to know how to apply what and when.

Thank you for this question which many people are wondering about at present because several major stocks and indices are testing their respective secular trend means, defined by the 1000-day MA.
In the Chart Library we only calculate moving averages using daily closing data. That result in then plotted on any time series regardless of whether one is looking at a daily, weekly or monthly chart. Historically, systems defaulted to a simple moving average but many technicians and algorithmic traders use exponential averages.
Bloomberg calculates average of daily charts using daily date but calculates weekly charts using weekly data and so on. That will have an effect on what level the average is displayed at.
The most important thing to remember is that in real time, the absolute value does not matter. Markets tend to overshoot in both directions. A reversion towards the secular trend mean is usually a medium-term buying opportunity if the secular trend is still intact. However, a new source of liquidity is usually required to provide the fuel for a rebound. That is not readily apparent at present.
The clearest evidence of a change of the secular trend is when the price series encounters resistance in the region of the mean and extends the decline. In secular trends the 200-day MA never trades below the 1000-day MA for a sustained period.
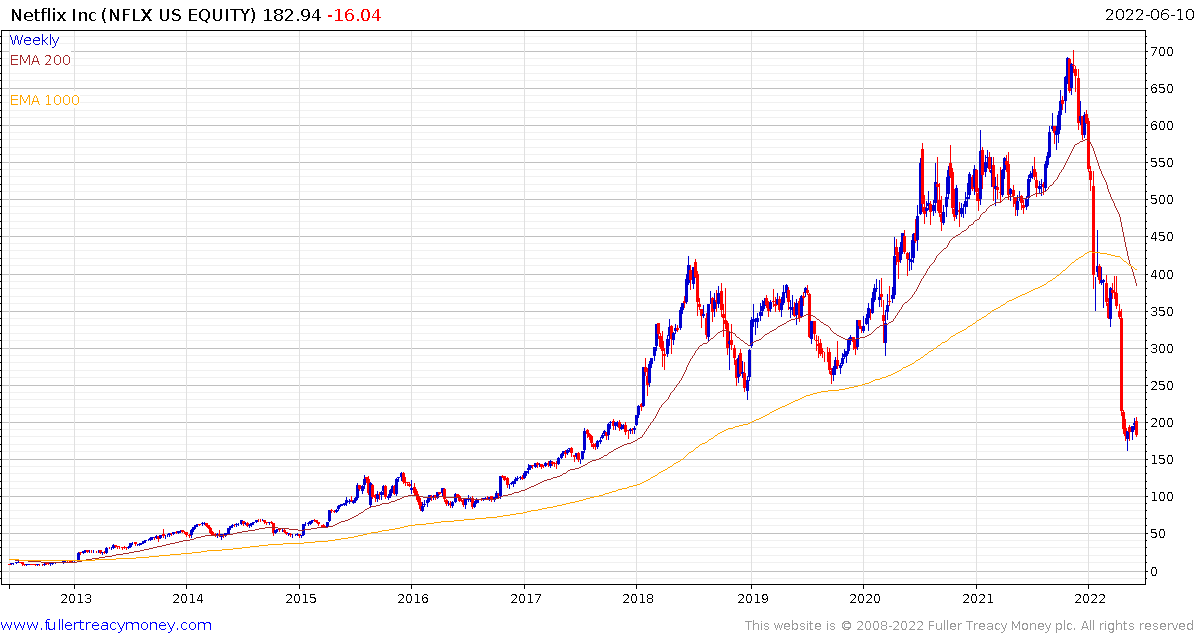 For example, Netflix’s 200-day MA has now fallen through the 1000-day MA. The best that can be hoped for is volatile ranging for at least the next few years.
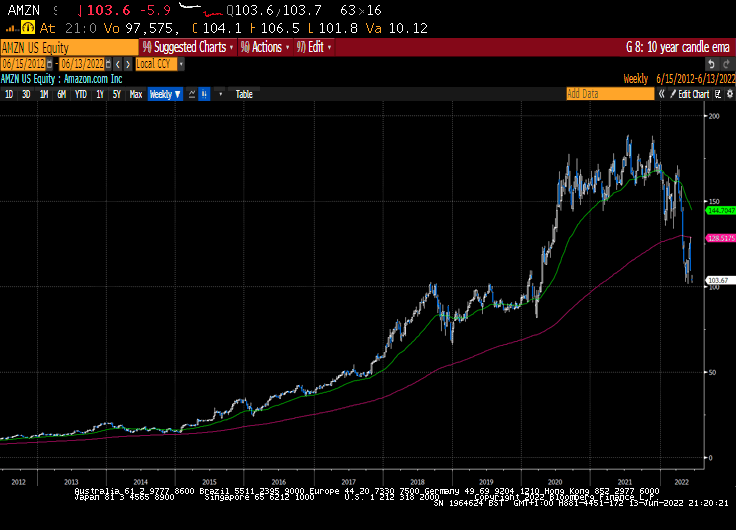 Amazon has encountered resistance in the region of the 1000-day MA and posted a downside weekly key reversal in the process. That’s really bearish action.
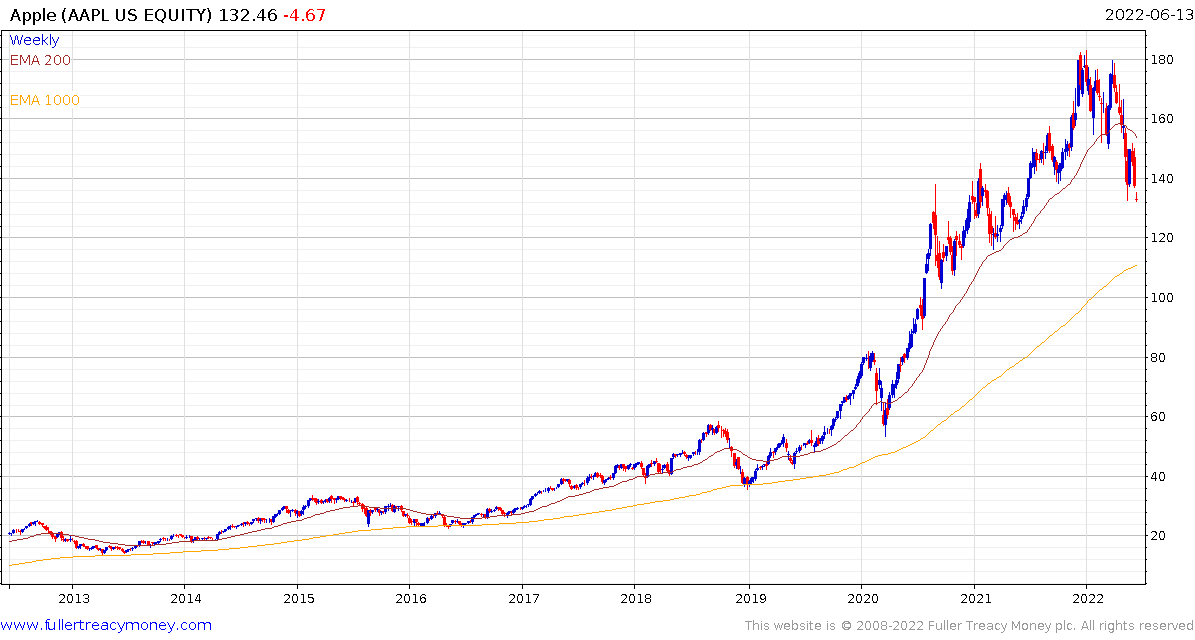
Apple encountered resistance in the region of the 200-day MA and the lower side of the overhead trading. A full reversion towards the 1000-day MA appears to be the most likely scenario.
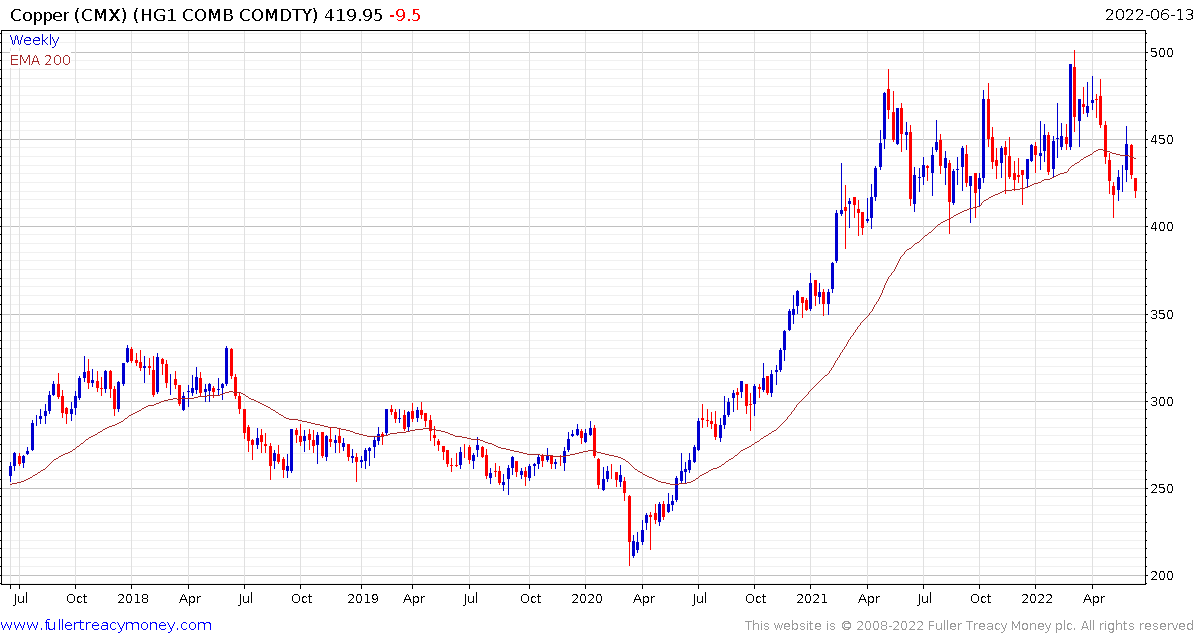
Commodities have held up admirably but copper has Type-2 top formation with righthand extension characteristics. It pulled back sharply from the region of the 200-day MA last week.
Cyclically, commodities tend to hold out longest and are among the last to decline as a recession begins.
The USA’s first quarter contraction was driven by “technical factors” like inventory liquidation. Building inventory becomes an asset on the balance sheet so selling it off as quickly as possible reduces the value. Target’s share price is collapsing because they signaled they have way too much inventory and are going to take the hit now to liquidate it. If that is the beginning of a trend, it will have a meaningful effect on earnings over coming quarters. Tesla warned of a very tough quarter today so it is not just about retailers.
The sharp increase in the cost of living this quarter and the impact that is having on spending patterns suggests the potential for a growth surprise to provide a second consecutive quarterly contraction cannot be ruled out. The front end of a recession might be a lot closer than expected.
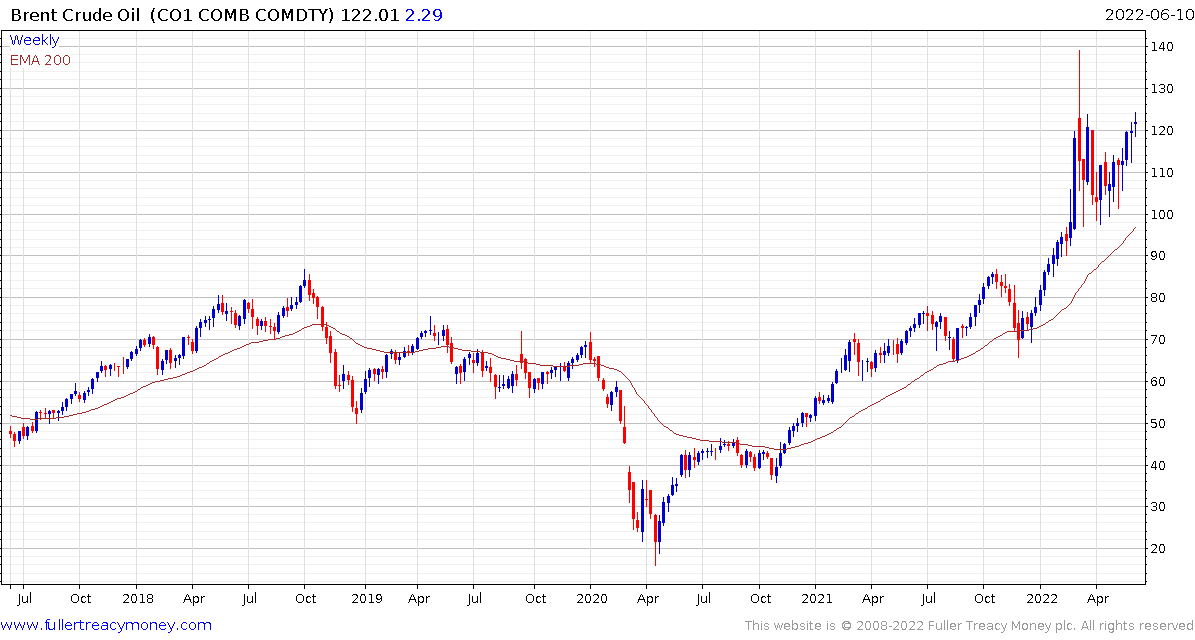
The continued resilience of the oil price is further cause for concern.