
Email of the day on monetary measures
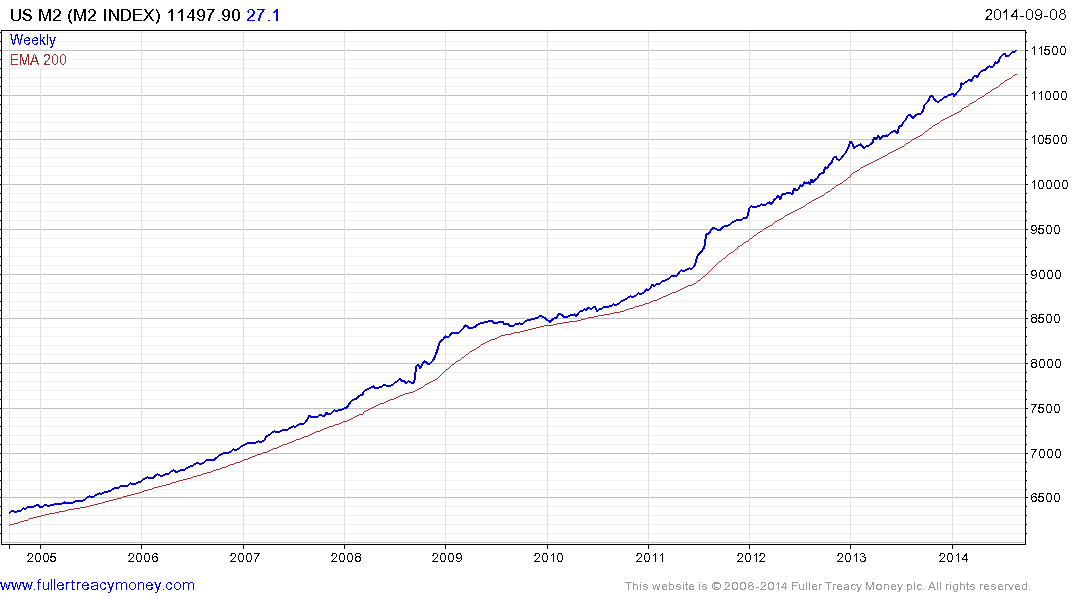
Please ask Eoin to review US M2 index the velocity of US M2 index, and the multiple of US M2 and Velocity of US M2. I realize it is three instruments but they are all from the same family. These were the most important charts in Crowd Money from my estimation.

Thank you for this reminder. The expansion of the supply of money has made a great number of headlines over the last few years, not least as savers saw their holdings eroded by negative real interest rates. In such an environment it would have been easy to conclude that the only possible outcome was rapid inflation as the supply of money overwhelmed available demand. However that has not occurred, at least not yet, and the deterioration in the velocity of money supply helps to explain why.
Velocity of Money peaked in the 1997, has been trending lower since and hit a new low when it was last updated in June. We can argue about whether the slimming down of supply chains as a result of the internet is to blame for this condition but the reality is that if velocity deteriorates supply must increase in order to ensure liquidity. Viewed in this context, the Fed’s massive increase in the supply of money as velocity accelerated lower is perfectly reasonable.
.png)
If we then look at the multiple of the supply and the velocity of money we should get a picture of the true liquidity situation. Unfortunately the most recent data will be accurate until the Velocity of Money is next updated.
Velocity of money charts are not available for the majority of economies but the prevalence of quantitative easing programs means that an increasing number of central banks are posting their holdings. Central bank balance sheets in the USA, Eurozone, UK, Japan and China have ballooned in response to emergency liquidity measures. Additionally capital is becoming increasingly mobile as the global market becomes progressively more integrated. Therefore money created in response to a slowdown in one jurisdiction is quite capable of fomenting asset price inflation elsewhere. Therefore while domestic liquidity is important it is far from the only source.
I created this chart of the combined total of central bank balance sheets then rebased it to US Dollars. Central bank balance sheets currently stand at $15trillion. While currency variability is a factor when combining the holdings of so many central banks, the chart highlights the considerable effect global central banks have had on total money supply quite apart from the Fed’s actions. This is a point worth considering as the Fed approaches the end of expansion and other central banks take up that mantle.