
Email of the day on lead indicators
You mention lead indicators, could you explain those you prefer?

At FullerTreacyMoney we look at two different types of lead indicator. The first is what one might think of as individual to the animating theme behind a trend, the others are broad market indicators.
Within any trend there will be instruments that offer clear leadership. By that I mean they will move first. They will bottom early and often top early too. In that regard leadership is a temporal designation because it has to do with timing. There are occasions when leaders will also exhibit relative strength within a move. However relative strength is a performance measurement rather than a timing measurement and that is an important distinction.
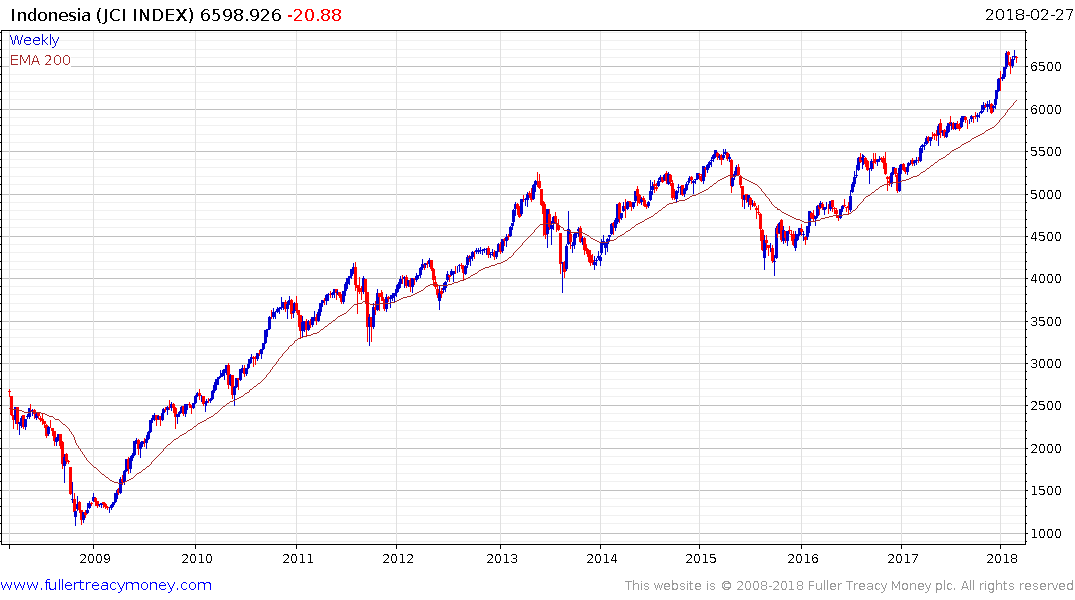
The instruments the bottomed in 2008 as opposed to 2009 might be thought of leaders. Indonesia is an important example and is emblematic of the leadership role the ASEAN region took on in the aftermath of the credit crisis. The Jakarta Composite Index is still trending higher in a reasonably consistent manner.
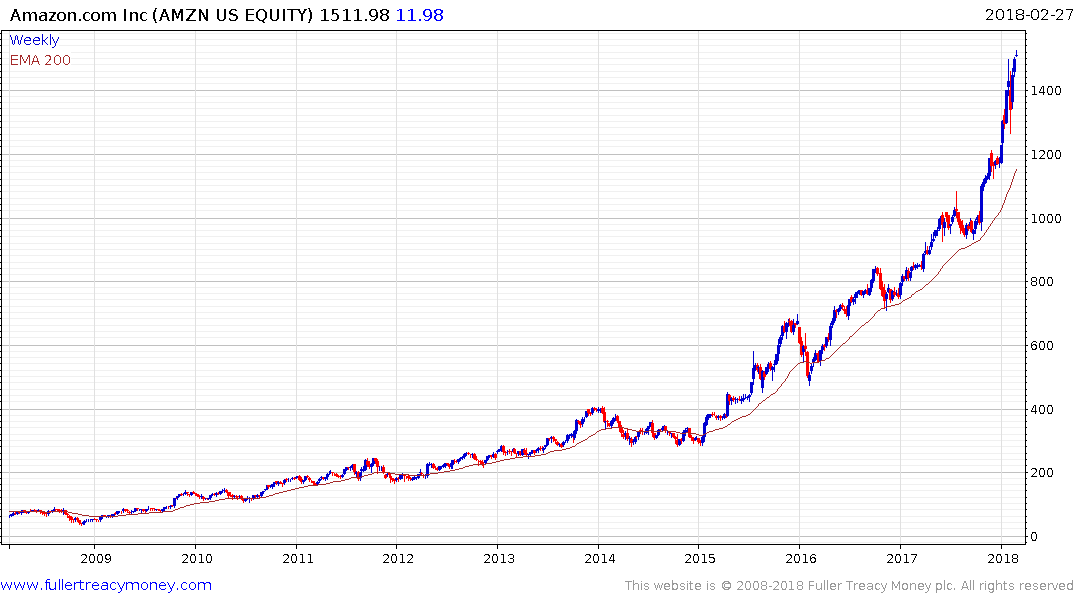
Amazon also bottomed in 2009 and it remains in a powerful uptrend.
Both Indonesia and Amazon offered early leadership and also exhibited relative strength at the beginning of the trend. The leadership designation is still in effect but relative strength comes and goes. It is reasonable to assume that the themes which really took off in 2008, such as the rise of the global consumer and the mass market appeal of ecommerce, will continue to represent bullish considerations until we have clear top formative characteristics in these instruments.
The other kind of lead indicators we look at are primarily related to the bond and credit markets. Credit often leads the stock market because interest rates affect the price of leverage and the bond markets are multiples the size of the stock market.
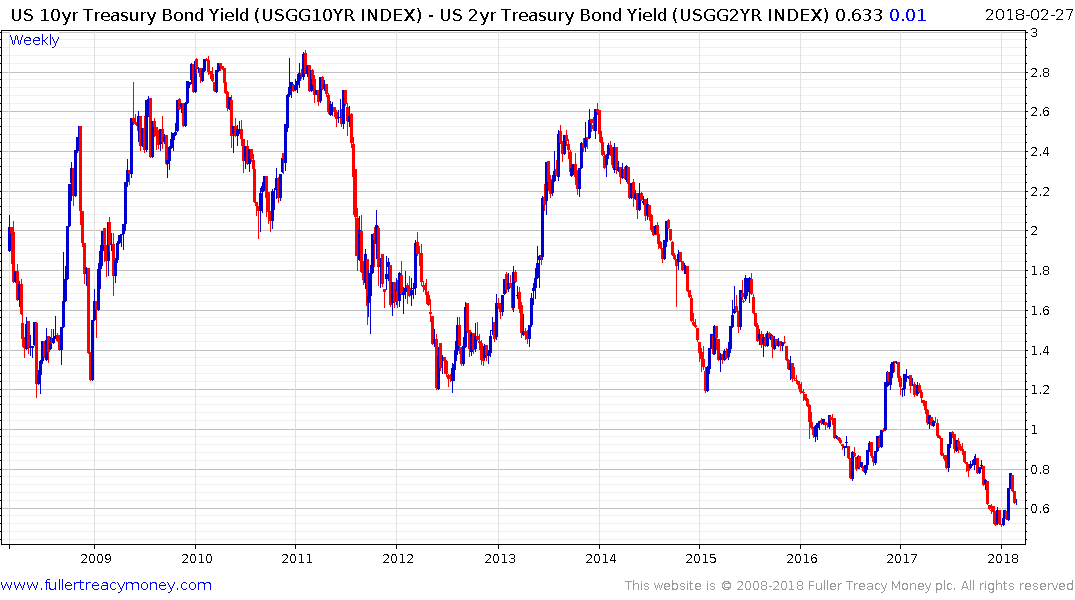
The yield curve spread has some of the most compelling long-term history of predicting recessions. When it moves below zero it offers a 6 to 18-month lead indicator for the next US recession. It has been compressing, from very elevated levels, for three years but it is still a long way from zero.
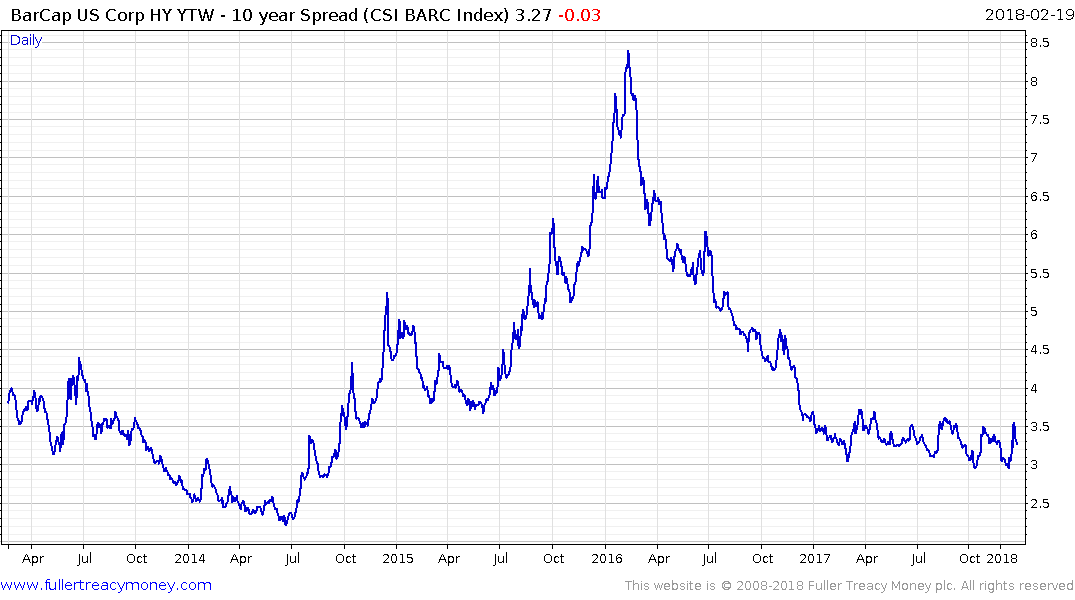
High yield spreads are also a reliable lead indicator of trouble in the stock market. There is a very clear rationale behind that because when companies have difficulty sourcing credit they have a greater likelihood to develop other troubles. As of now high yield spreads are still very tight and they mostly need to be trending higher for about six months before the impact is felt in the stock market.
There are other indicators people monitor like unemployment or credit card delinquencies, and these are important but they are often reported with a significant lag so they might be considering coincident indicators or confirming indicators at best.
Back to top