
Email of the day on intraday volatility in the VIX
I watched the VIX swinging today in radical, 3 point (21-24, for example) moves happening in a single tick. The 1 minute chart looks like a pissed off porcupine, with 3 point bars pulsing every couple of minutes. I called the Schwab Options Desk and they saw the same thing - then I called Larry McMillan and talked to his head trader Ryan who also saw the same thing (thus most likely eliminating a bad data feed at the receiving end). USD
This looks like a CBOE computer systems problem, at least from the outside. The VIX would only move 3 full points (15% ish) in a single tick if the option prices used to compute the VIX were moving in price radically. That would normally not be happening unless the SPX were moving radically (as in crashing), which it was not doing.
Given how important options pricing is to the overall market, this should be a bit of a red flag. I'm surprised no one in the press appears, at this hour, to have picked up on it.

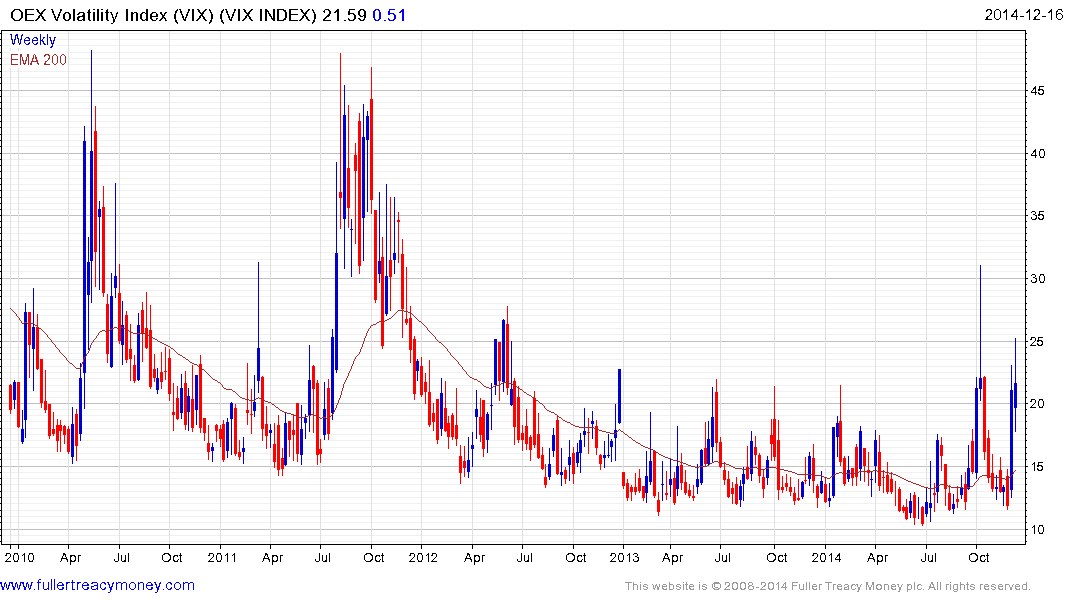
Thank you for this detailed report and I smiled at your colourful simile. The intraday spikes you speak of are evident on this 4-day intraday chart of the VIX Index and continued today. I don’t know the reason for them and would welcome some feedback from subscribers who might have additional insight.
Interestingly these spikes are not evident on the VIX futures chart suggesting that there may be an issue with how the spot Index is calculated
Volatility has not been a major topic of conversation for quite some time but I believe it is worth considering that automated trading systems necessarily have to consider volatility as they decide on position size. Low volatility allows for models to dictate larger positions because potential drawdowns are reduced. However this also works the other way around; high volatility means the model has to reduce position sizes in order to manage drawdown risk. Additionally high volatility is a signal to increase short positions. This helps to explain why the dip and turnaround in October were so swift.
By and large people tend to think about volatility as an absolute but it is probably also worth considering that the rate at which volatility changes is also reflective of investor sentiment. This article from Barron’s may also be of interest. Here is a section:
But Mandy Xu, an equity derivatives strategist at Credit Suisse, notes that a complex measure of the excitedness of VIX behavior itself almost tripled last week to near its all-time high. She’s looking specifically at the “implied volatility” of the VIX, which rose to 139 last week from 57.
It’s a kind of a Through the Looking-Glass market indicator — the VIX measures expected swings in the S&P 500, but this other index, the CBOE VVIX Index, tracks prices of options on the volatility index itself. It measures, quite literally, the volatility of volatility.
Sounds like an exercise in navel-gazing, but some see in the sudden ramp in VVIX as a sign that high-yield bonds (selling off for months) and stocks (still near all-time highs) might be about to reconcile their differences. Lots of people spend time trying to squeeze market signals from discrepancies in volatility metrics.
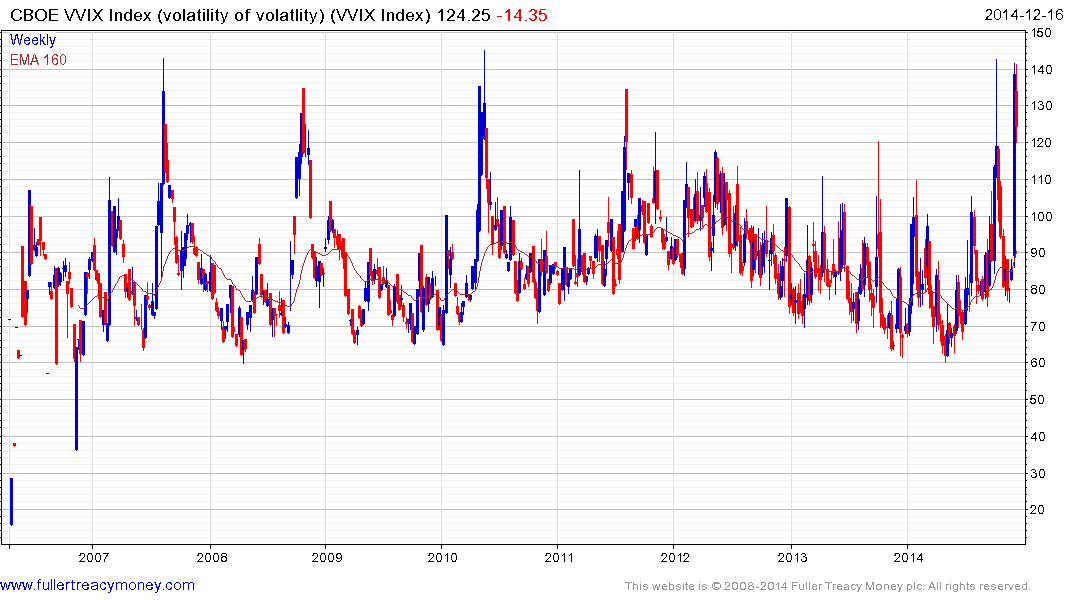
The VVIX Index, the so-called volatility of volatility is testing the upper side of its range evident since its inception in 2007.
From the above charts, we can deduce that volatility is finely balanced and as such the risk of an additional period of weakness on Wall Street cannot be ruled out.
Back to top