
Email of the day on interpreting ratios using behavioural technical analysis
David's mention yesterday of the possible bottoming of the Dow/Gold ratio prompted me to consider the analysis of charts of ratios. Should a chart that is formed from a ratio of two component market prices be analysed in the same way (using the same technical and behavioral guides) as a 'non-ratio' price chart? Many thanks.

Thank you for a thoughtful question which comes up from time to time. Investors are always making relative value decisions when they allocate capital to one asset class or another so I believe it is possible to interpret popular ratios such as the Dow/Gold ratio in terms of psychology in the same ways as absolute price charts.
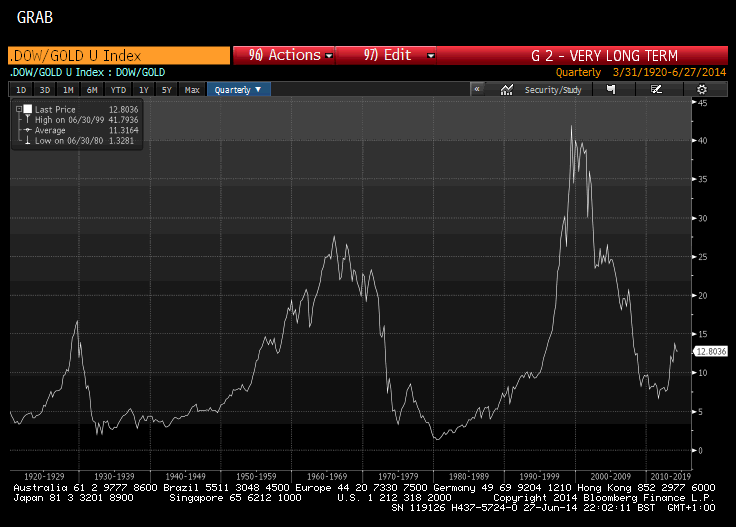
Additionally the secular cyclicality of the ratio over more than 100 years suggests that it is worth paying attention to at the major turning points.
I have heard more than a few die hard gold bugs contend that the recent rally in the index is similar to that posted between 1974 and 1976 and that it will subsequently fall to even lower levels. This might turn out to be the case but at present it appears an outside possibility.
Back to top