
Email of the day on gold, ratios and real rates
In contradistinction to your bullish backdrop for gold and your contention of an eventual breakout (not breakdown) of the price, I would appreciate your comments on the relevance and significance of this part of the John Authers’ Points of Return article in Bloomberg this morning:
The Loser of the Year of the Vaccine: Gold
The last 12 months have seen a steady rise in inflation, yet gold has Authors taken a drubbing. That is weird, because the precious metal has long been regarded, more or less correctly, as a hedge against inflation and monetary debasement. There’s been a lot of both inflation and money-printing in the last 12 months, and yet gold has declined, with miners of the metal becoming the single worst-performing sector in the S&P 500.We would have found this even harder to predict if we had been told a year ago that real yields would stay solidly and historically negative. Gold has no yield and historically has a strong inverse relationship with real yields. The less bonds pay after inflation, the less unappealing gold will appear. But real yields have remained bafflingly low and that hasn’t helped:
As the chart indicates, there is only one other period since the crisis that looks anything much like this. Unfortunately, that was in 2012 and early 2013, when real yields stayed low during the Federal Reserve’s “QE Infinity” and gold began to fall. It turned out on that occasion that the price was telling us something. The spring of 2013 saw first a dramatic fall for gold and then the “taper tantrum” as bond yields shot upward in response to a hawkish Fed.
Another indicator looks surprising. The ratio of stocks to gold, the effective price of the S&P 500 in ounces rather than dollars, has stayed surprisingly constant since Richard Nixon removed the U.S. from the last vestiges of the gold standard in 1971. The S&P has been worth more in gold terms than it was in 1971 only for a few years at the top of the 1990s bull market. Despite all the worries about debasement, that golden ratio is now stronger than it was in 1971, and at a 16-year high:
It’s possible that gold’s admirers have deserted it for cryptocurrencies, of course. There are various explanations out there. But the interpretation that it’s telling us to beware a possible tantrum in the bond market and correction in stocks seems fair.

Thank you for this email which raises a number of important points. I don’t mind admitting I have found the Dow/Gold ratio to be particularly perplexing over the last three years. For the first 15 years of my career, it was the most reliable of all long-term ratios. It had a wonderful history of cyclicality which depicted the ebb and flow of capital between asset classes over more than a century. It was one of the primary tools for rationalising the beginning of a secular bull market in equities from 2011 onwards. Then it pulled back in a big way in 2018 which raised big questions about the consistency of the move.
The reason we use generally use the Dow Jones Industrials Average as the long-term barometer is because it has the most back history. The S&P500 was created in 1957 and until the last few years that was as much back history as one could get. Since they have back filled the price history.
I don’t know if that is with the data from the Dow or from the original constituents of the S&P total market index from the 1920s. Since the S&P500 is supposed to depict the health of the economy, it would make more sense to use the Dow for the earlier history.
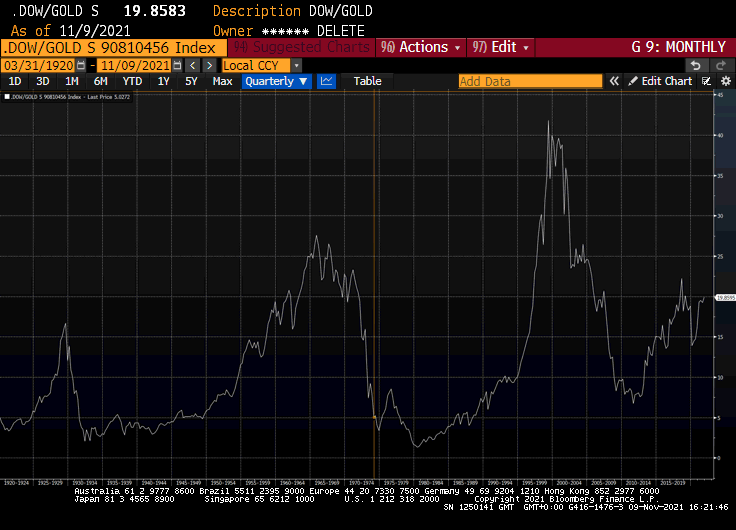
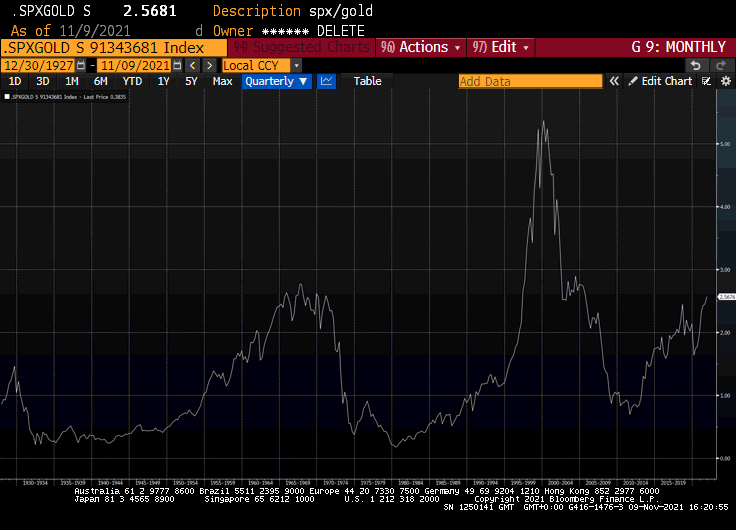
That of course begs the question whether one should still use the Dow for today since the economy is much more services oriented. The “right” answer in this cycle has been to use the S&P500. The ratio is now at a new recovery high while the Dow/Gold ratio is still shy of the 2018 peak.
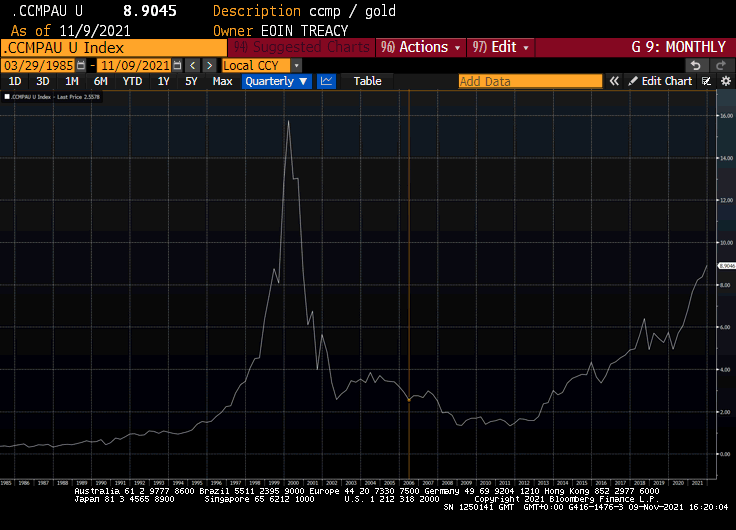
The even more correct answer has been to focus on the Nasdaq Composite/Gold ratio.
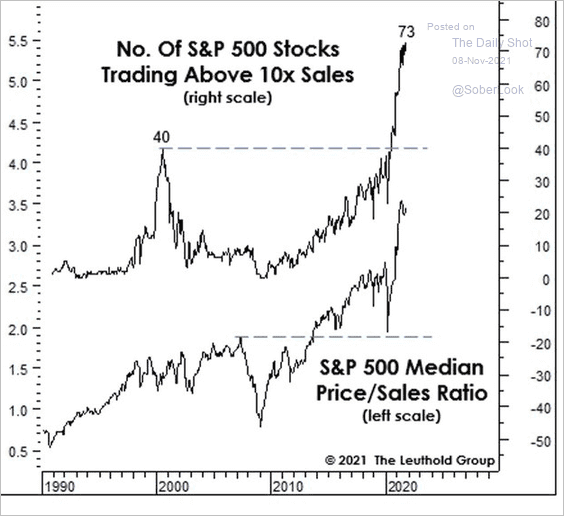 The price to sales ratio of the S&P500 is way above the levels reached in 2000. I’ll be the first to point out that fundamentals are in no way a timing tool. This bull market is probably the first to be truly global in nature and the USA has the most big global companies so it continues to attract the most capital, so higher valuations are to be expected. Nevertheless, when these ratios begin to turn downwards it will be a sign of trouble.
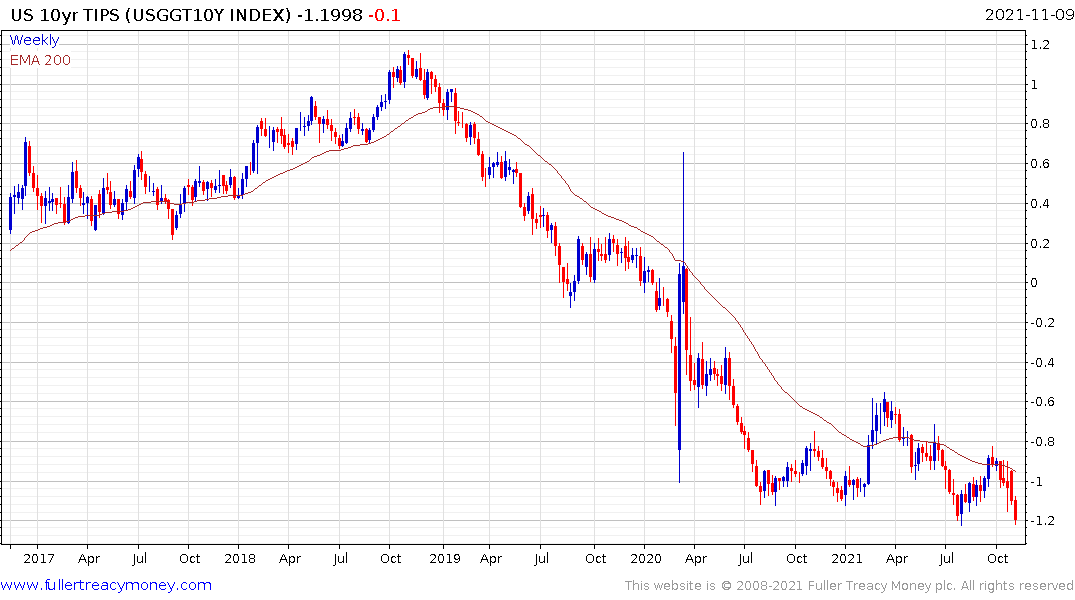
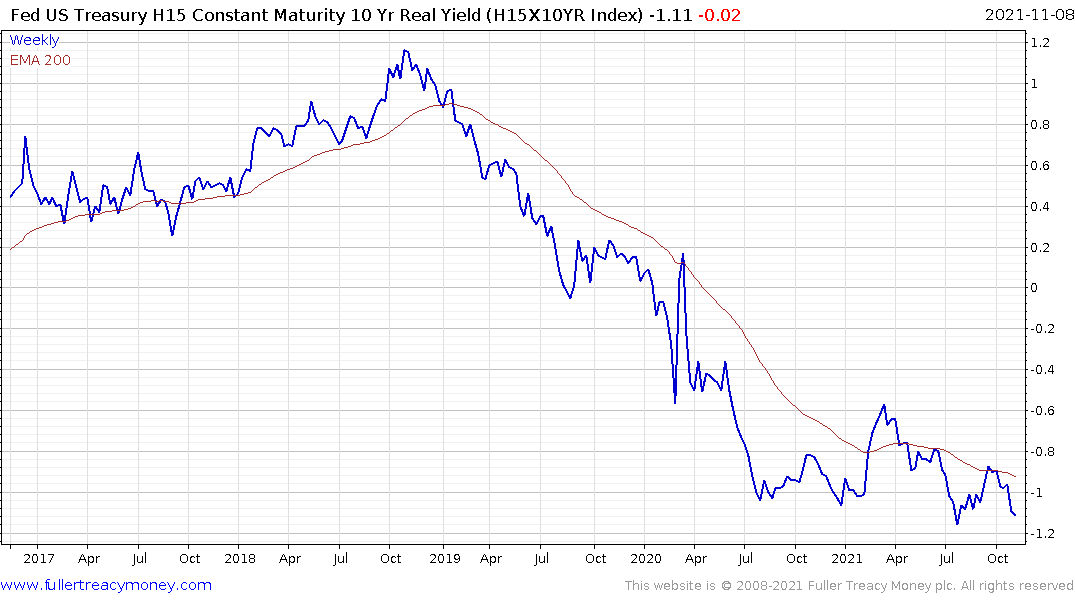
I am very leery of using TIPS as a reliable measure of inflationary perceptions, but the yield continues to trend lower. The Fed’s own Constant Maturity measure of real yields has been ranging for more than year; following a steep decline to the 2020 low which coincided with gold’s peak.
It is not correct to say gold is an inflation hedge. There are too many types of inflation for that to be universally true. It does well when central banks are inhibited from raising rates because of exogenous factors. That’s where we are right now. The major central banks can see headline inflation ramping higher and they are terrified of raising rates because they are worried about the damage that would do to the expansion.
I am increasingly of the view that inflation is going to surprise on the downside in 2022. Central banks are beginning to shy away from using the word “transitory” because the supply shortages have been around for longer than they anticipated. Chips contribute more than many realise to headline CPI so any easing of that phenomenon will lead to lower readings.
Eventually, Germany will give Russia what it wants and the Nordstream 2 pipeline will open. That will relieve stress on natural gas prices. Meanwhile there is an increasing likelihood food prices will spike higher on shortages of both fertilisers and labour. Wage demand growth is still likely to continue to be a dominant factor. Oil prices remains firm and will continue to be until there is a significant supply response. That’s dependent on OPEC+ pumping more or shale plays sourcing investment capital to begin drilling at scale.
In other words, we are going to remain in a lumpy statistical environment that will contribute to central bank reluctance to normalise policy. That’s a recipe for strong performances from gold and stocks (short-term overbought condfitions notwithstanding).
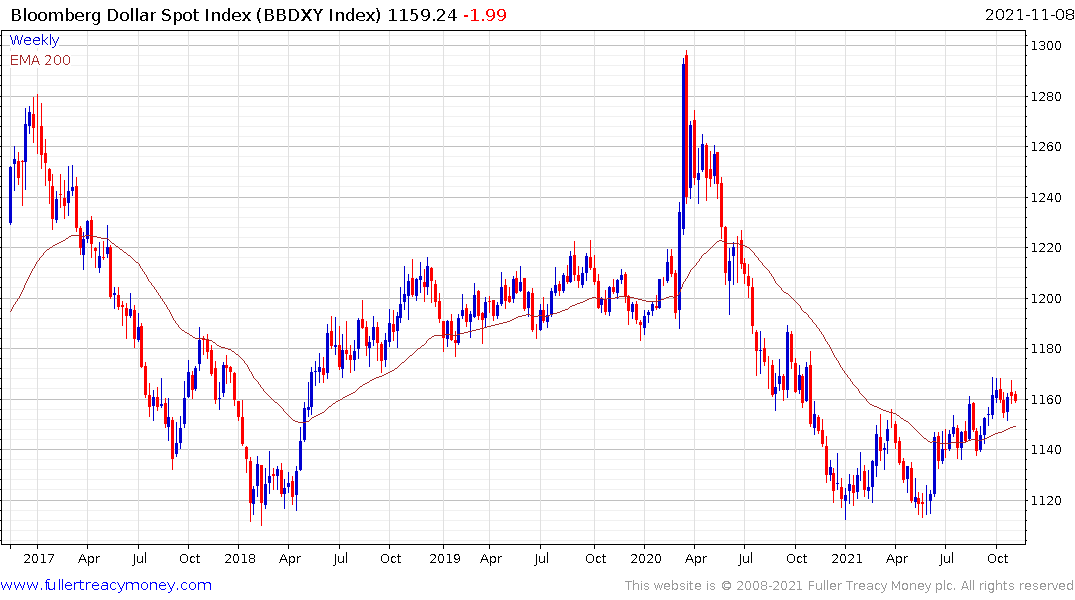
.png) The one thing I have seen no comment on has been the propensity of gold and the Dollar to rally in tandem over the last few months. The inverse correlation between the two is on pause for the moment and suggests there is some hedging activity going on. This condition will not last indefinitely.
The one thing I have seen no comment on has been the propensity of gold and the Dollar to rally in tandem over the last few months. The inverse correlation between the two is on pause for the moment and suggests there is some hedging activity going on. This condition will not last indefinitely.
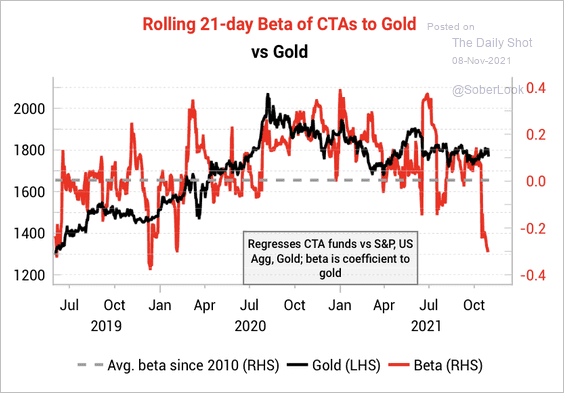
Meanwhile gold is being set up for a short squeeze if the positioning on CTA funds is any guide.