Email of the day on Dow Theory for the 21st century
Hope you and the family are well Eoin, no doubt your children are pretty grown up now, although probably still on the payroll.
I know David would have been fascinated with the ‘Capitulation Indicator’, that forms part of a ‘Dow Theory Buy Signal’, so I attach my 2-page note on that indicator also. It dovetails well with the ‘Dynamic’ move at the ned of a bear markets that he looked for. I was sorry to hear of his passing, way too early in life.
Feel free to share both of the above attachments, if you deem them of interest to your own subscriber base.
Thank you for generously sharing your two research reports. My girls (13&15) are certainly still on the payroll and continue to demand higher wages ????. I agree David would have appreciated the data on capitulations in the stock market over the last 80 years. His identification of acceleration as always being a trend ending is perhaps one of the most useful of observations as well as dynamic moves representing points of interest for the investment crowd to denote change.
Here is a link to the report on capitulations and here is a section on the modern Dow Theory:
Charles Dow used two indices, the Dow Jones Industrial Average Index (DJIA) and the Dow Jones Transports Index (DJTI), insisting that a potential transition from bull to bear market (or vice versa) had to be confirmed by both indices before a signal that the market had turned was valid.
Jack Schannep’s research, as outlined in Dow Theory for the 21st Century, highlights that a signal from the S&P 500 Index and at least one of the other two indices works best (i.e. the S&P 500 Index along with confirmation from either the Dow Industrials or the Dow Transports Index).
The higher highs, higher lows principle (for bull markets) and the lower lows, lower highs principle (for bear markets) represent trending markets. What Dow Theory attempts to do is determine when the primary trend has reversed.
The exact rules for calling the turn in markets under Dow Theory for the 21st Century are numerous, and we don’t intend to cover all the variations here, and we might summarise the major signals as follows: Bull to Bear Market Sell Signals:
• A secondary reaction in an ongoing bull market occurs when the S&P 500 Index plus one other index decline by more than 3% over a minimum of 10 calendar days on 2 of the 3 indices (S&P 500, Dow Industrials & Dow Transports) with at least 8 trading days as the average for all three indices.
• The S&P 500 Index plus one other index must then rally at least 3% but close below their previous highs.
• If the S&P 500 Index and at least one other index then declines again, and closes below the previous lows, a ‘Sell’ signal is given.
• If during a decline, the markets don’t rally the required 3% and the S&P 500 Index plus the Dow Industrials decline by 16% (Jack Schannep’s definition of a bear market), a ‘Sell’ signal is also given.
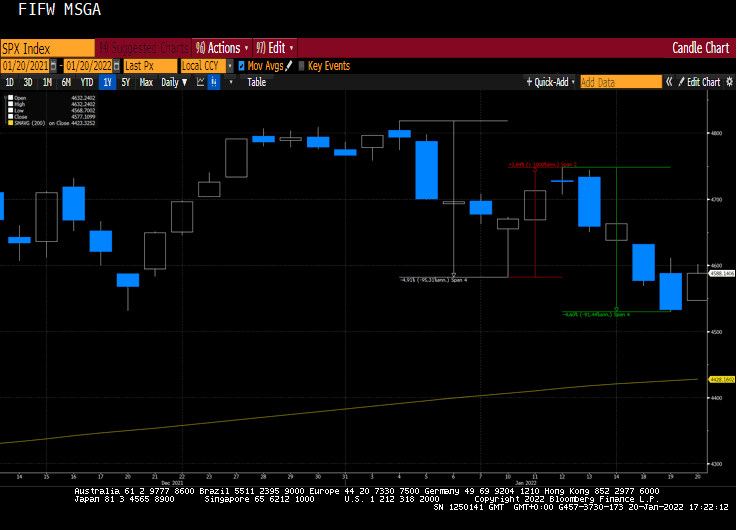
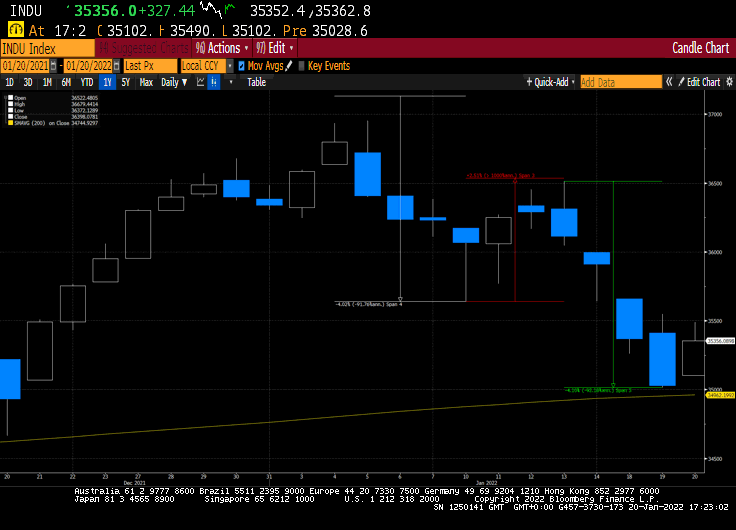
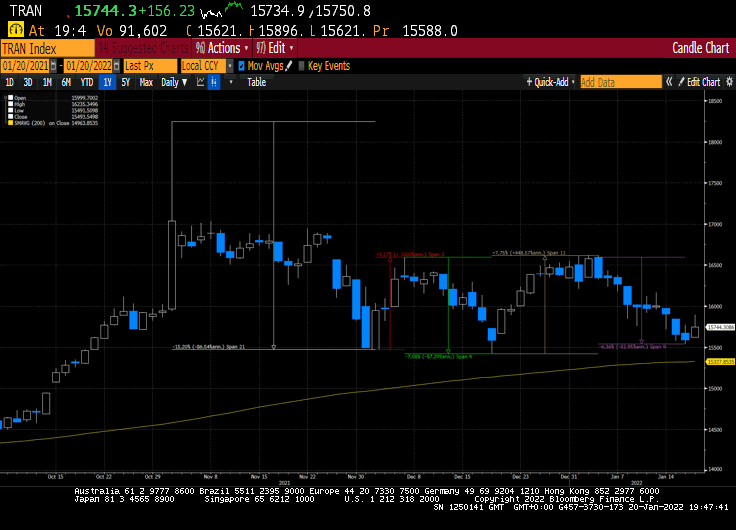
Of the three indices in represented in the 21st Century Dow Theory, both the S&P500 and Transportation Average have met the conditions for a transition from bull to bear market. The Industrials Average did not quite rally by the requisite 3% following the initial decline. The Transportation Average peaked in November and has been trending lower, albeit modestly since so that made it easier for the S&P500 to meet the additional criteria.
I’m reluctant to take this as more than a warning that the risk of a medium-term correction is rising. After almost two years of markets trending higher in a very persistent manner, it is not surprising to see greater volatility as monetary policy normalisation is considered.
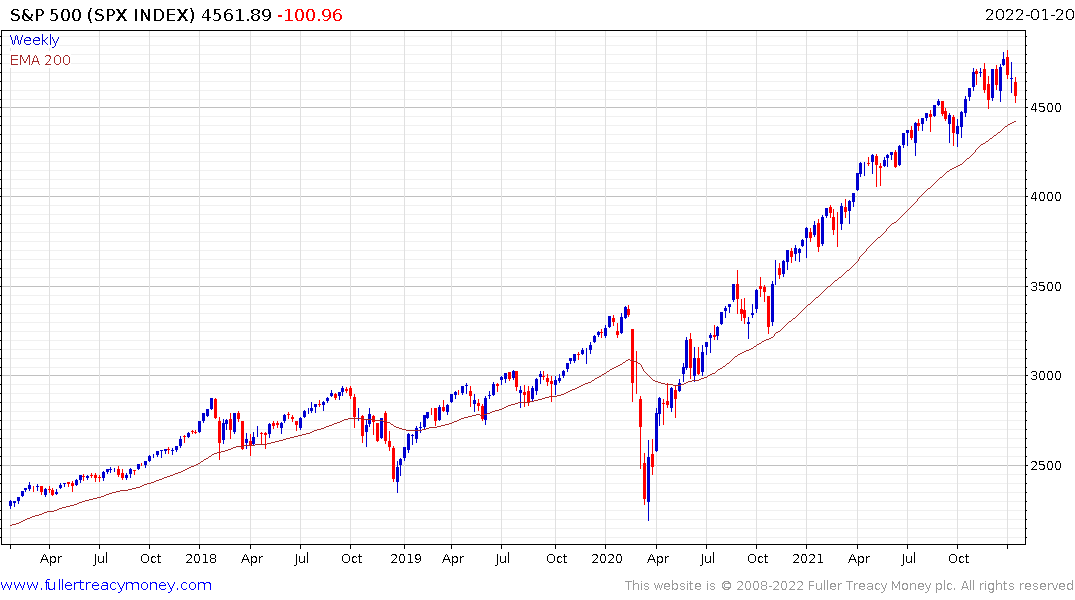
Meanwhile, the reactions on these indices have so far been limited to reversions towards the 200-day MAs and the S&P500 continues to hold support in the region of the September peak.
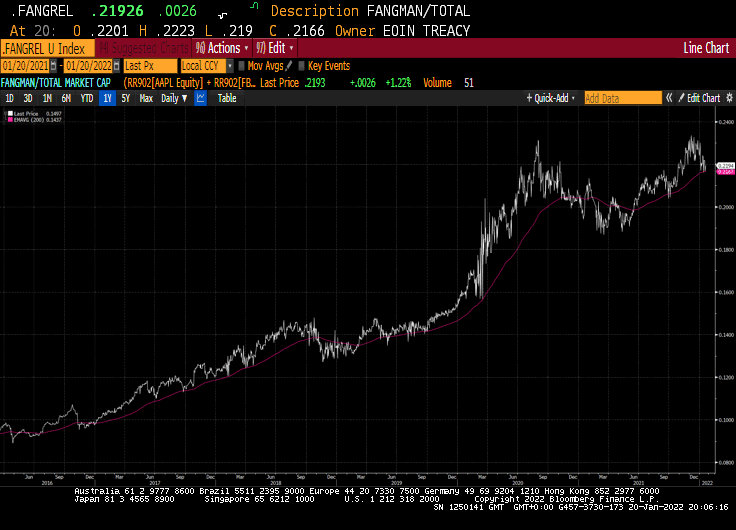
The FANGMANT/Total US market cap ratio continues to hold support in the region of the trend mean.
I strongly believe the market has gotten way ahead of itself in pricing in interest rate hikes and China is now speaking more openly about the need for stimulus. Financial conditions are still very easy and high yield spreads are contained. This suggests a medium-term correction rather than a major market peak is the more likely bear market scenario and, even then, sustained moves below the trend mean would be required to confirm that.
Jeremy Grantham holds the opposite view and expects contagion into the defensive, large and mega-cap sectors before long. I don’t disagree with the bubble argument. Some valuations are extraordinarily high but for a bubble to burst liquidity needs to be removed and that has not even started yet.
Nevertheless, there is no denying that Wall Street is richly valued and very reliant on corporate profit growth being sustained. If the energy transition is a reality, emerging markets, commodities, and gold will be a safer and ultimately more rewarding place to be. I’ve spoken and written about the push and pull of markets. Right now, these sectors represent a pull factor. Underperformance by Wall Street and the Dollar will be required to signal a significant push factor out of US stocks.
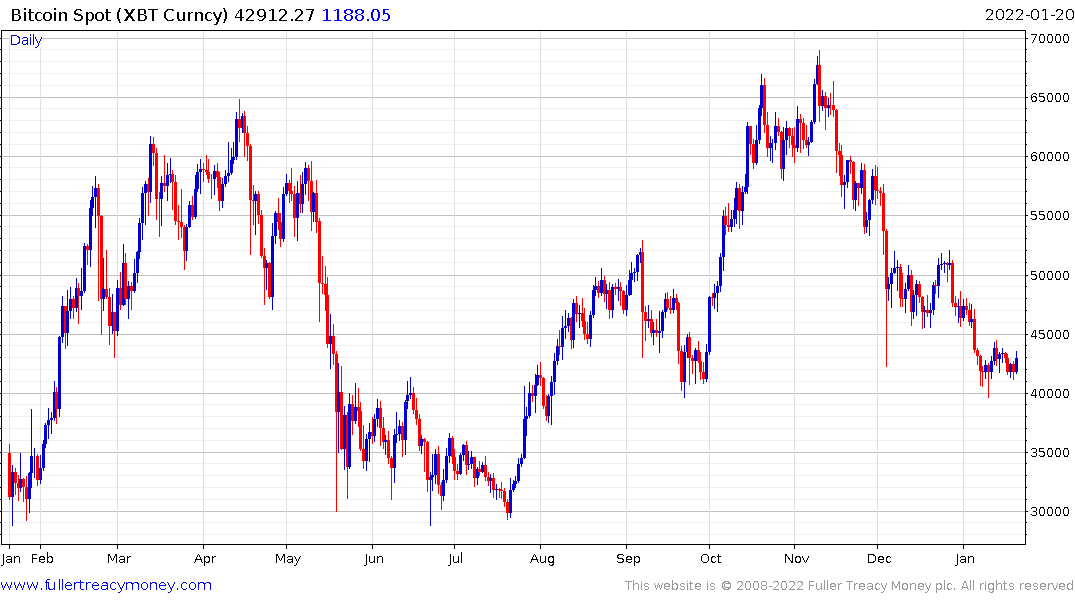
Bitcoin, as the ultimate risk asset, has been a lead indicator for Wall Street’s performance over the last couple of years. It’s bounce from the $40,000 level this week suggests some unwinding of short positions.


