
Email of the day on an illustrative ratio
“I read that Warren Buffett uses the ratio {NYSE market capitalisation}/{US GNP}. Is it possible to show the graph of the ratio for the last 50 or more years (or as long as possible), using perhaps monthly data for the market capitalisation? If you can provide such a graph (and add to the chart library), please give some indication of level of the ratios on the y-axis of the graph.”

Thank you for this suggestion. Following an extensive search on Bloomberg I identified an index representing the total market cap of the US stock market and added it to the Chart Library. This index dates from 2003. I’m afraid I could not find an index for the NYSE’s market cap. If subscribers can suggest such a data series and particularly one with more back history I would be happy to investigate how to add it.
.png)
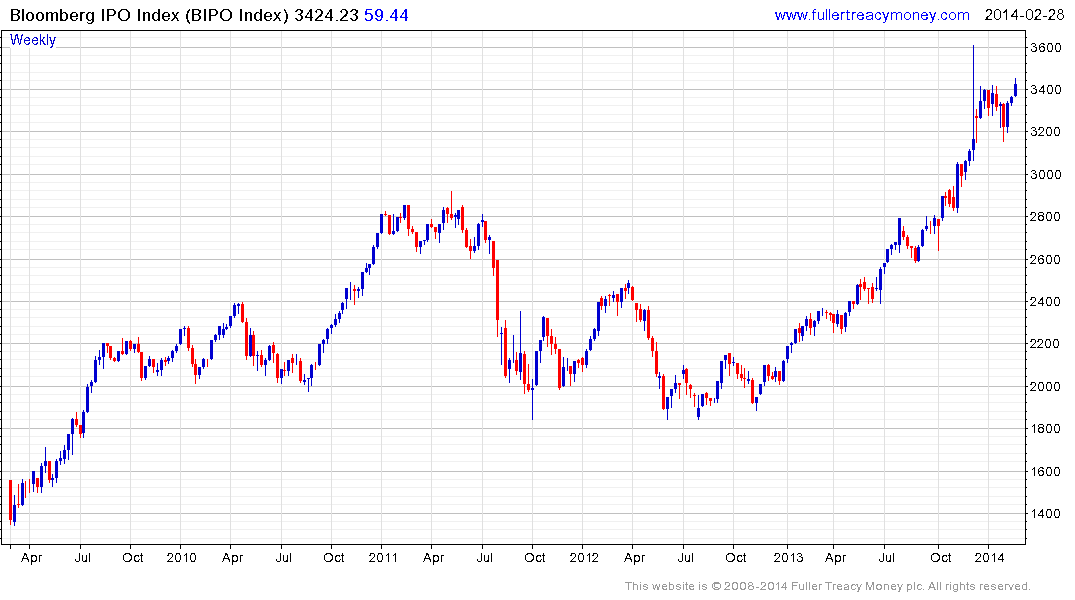
As you can see the ratio has returned to test the 2007 peak which is a feature common to a number of other valuation metrics. In effect what is tells us is that the market has gone up a lot over the last five years and that valuations are similar to where there were before the credit crisis. As subscribers will be aware, we have been pointing out that the outperformance of IPOs and the return to form of cyclical sectors such as basic resources can generally be interpreted as late in the cycle phenomena. This ratio helps to illustrate the point.
Back to top