
Email of the day on a difficult environment
“Great audio forcing me to take a step back when looking at the markets. My thoughts are as follows. What could be the reason or reasons for the US indices to go higher from here despite the overbought condition? With the US indices dominating the direction of the market European shares are in my opinion unable to go higher without the US going higher. The stronger euro since mid- March even caused low P/E, high dividend paying European autonomies to go lower when the US market went higher.
?The overlay chart SP 500 versus the Dax shows the depressing performance of European shares not going higher when the US was going higher and going down when the US went lower; ironically making Europe even cheaper and the US even more expensive. Hope is often causing a deferred loss but still I am hoping you can give me a reason or reasons for the US indices to go higher and force the shorts to cover. Apparently the shorts are still massive could you confirm? I was unable to find an updated chart on short positions in the chart library.
If on the other hand the US would start a correction Europe will most probably go down with at least the same percentage. I feel trapped when looking at Europe even without mentioning the Brexit risk. Fortunately we have commodities and commodity shares who look on a risk/reward basis very attractive. Eoin thanks for all your valuable info have a great weekend.

Thank you for your kind words and I’m delighted you enjoyed the audio. Something Mrs. Treacy and I always joke about is when in, primarily US, sitcoms, the protagonists rely on the “it’s complicated” line to admit their failure to explain their actions clearly. I’m reminded of this right now as we observe the financial markets.
There are a lot of competing arguments right now and if we take a step back and look at what the market has been doing for the last 18 months there is a good reason for that. In a range supply and demand come back into balance, so the arguments to support each case are afforded almost equal credibility in the eyes of investors. It is not until a breakout in either direction is confirmed that the veracity of the argument is confirmed however.
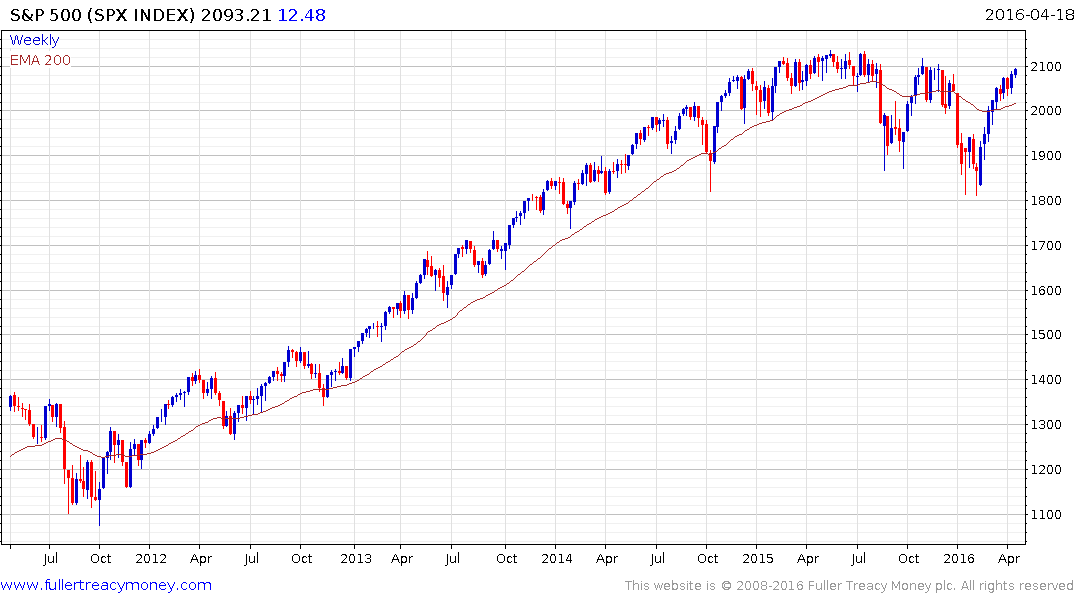
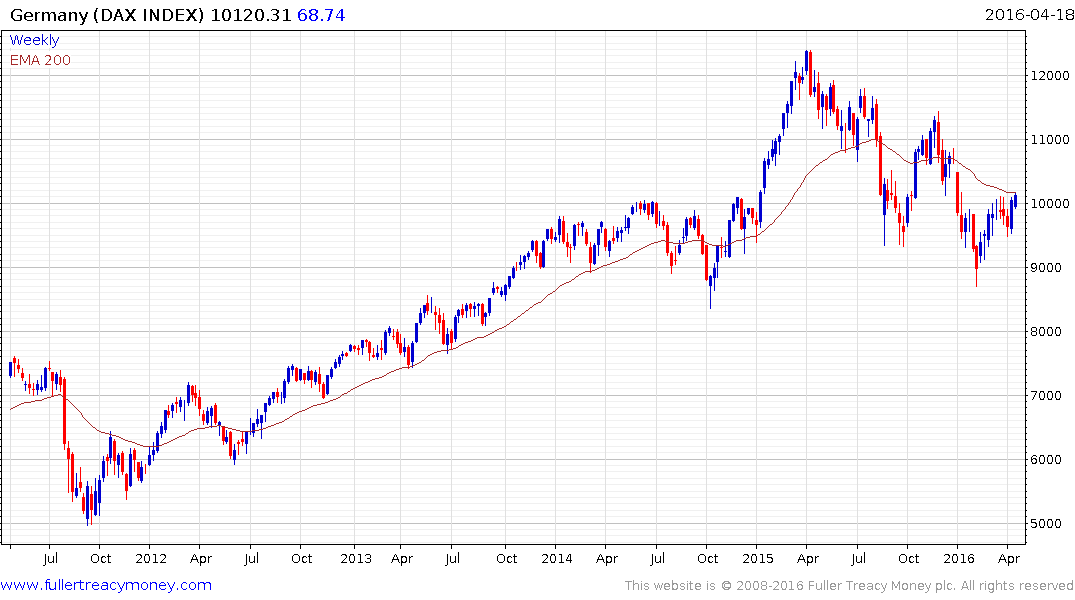
I agree the Wall Street leash effect has not evaporated, so the S&P has to be reasonably steady if the rebound in European shares is to persist. However it is also worth remembering that in order for shares to get attractive valuations they have to first fall so that even though they might have underperformed in the last couple of quarters that does not mean the same will be true in the next few quarters. Europe has experienced a much sharper pullback than the USA so it has greater scope for a rebound.
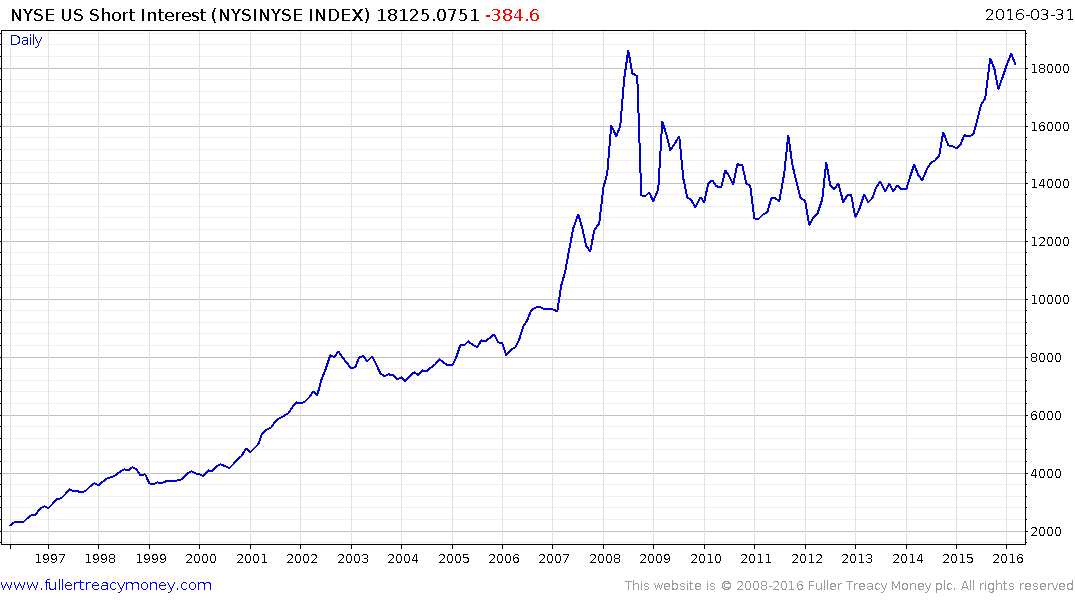
I have also seen a lot of commentary about the number of shorts in the market and found the following two charts. The total number of shorts would appear to bear out the contention that we are close to seeing a record number of bearish or hedged bets.
.png)
However we also need to consider that the total market cap of the market has also increased substantially, so the US Short Interest as a % of Free Float for the Total US Market is probably a better indicator of the actual market condition. It bears a closer resemblance to what we see in terms of the overall market action. The number of shorts has increased over the last year but is a long way from the peak posted in early 2008.
Two additional charts are worth considering. The first is that Total Margin Debt has been declining since early 2015. It has hit important peaks at major market peaks so this is not something that can be taken lightly. With the prospect of interest rates rising in the USA leverage will get more expensive and that is a legitimate consideration for traders.
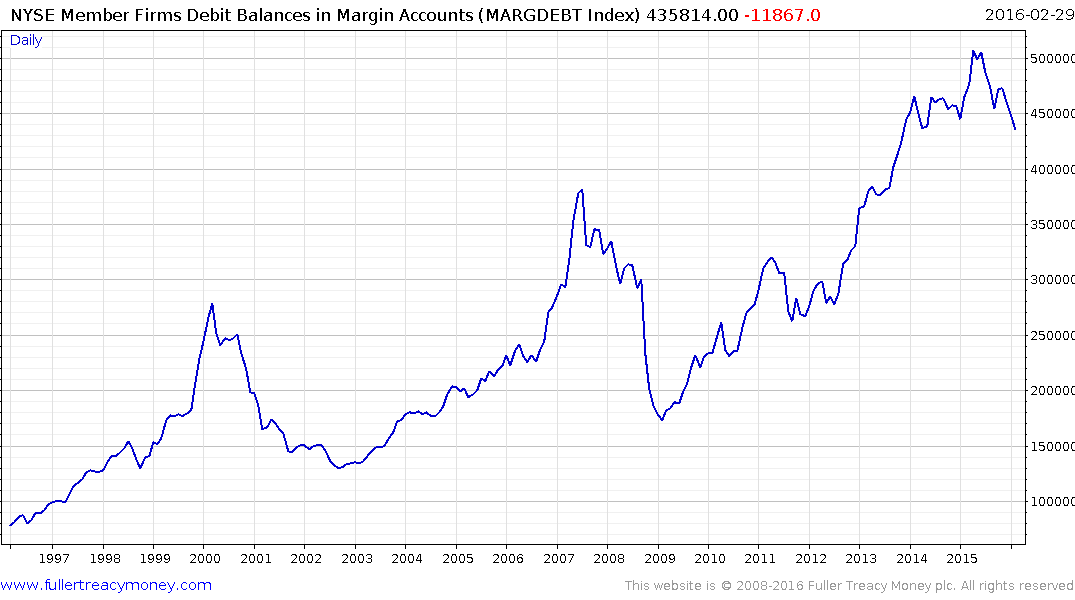
The problem with this index is that it is only updated once a quarter and the first quarter update has not been released yet. US Corporate Profits share a similar pattern of decline over the last year and is also updated on a quarterly basis.
.png)
The total number of shares trading above their 200-day MA might give us an idea of what traders are doing right now. The Index tested the 2011 and 2008/09 lows in January and has since staged an impressive rebound to break a three-year progression of lower rally highs. With nearly 60% of shares now trading above the trend mean a clear downward dynamic would be required to signal a return to supply dominance.
Taking these two charts together we can see that medium-term clouds are gathering as the world’s most significant central bank alters the status quo that has persisted for the better part of a decade. Short-term this has been an impressive nine-week rally and the S&P is now trading in the region of its previous peaks. Some consolidation of that gain is looking more likely than not but a clear downward dynamic will be required to check momentum and signal a return to supply dominance.
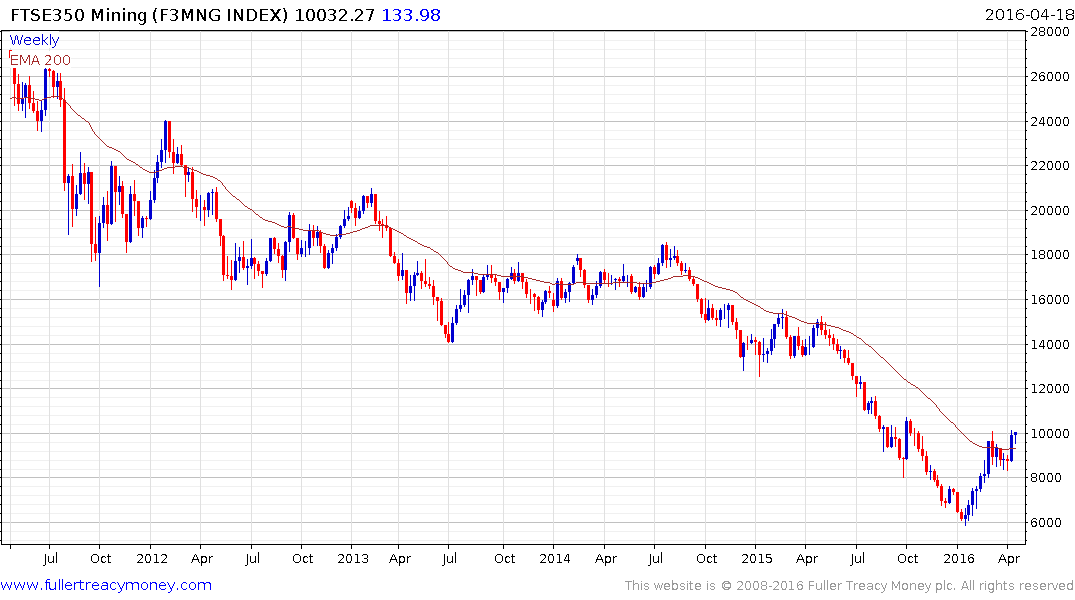
Meanwhile the continued rally in the resources sector is an indication that a lot of bad news has already been priced in and economic statistics, which tend to be a lagging indicator, might be beginning to turn upwards.