
Email of the day - on lead indicators in this cycle:
Hope all is well.
I had a question about the comment you made at the end of your video today. You mentioned that the indicator that we should focus on which will lead to this current cycle unwinding is Private equity and the success of their investments, plus on government debt and the deficits they are building.
Are you able to expand on what we can track (tangibly) for these 2 issues?
Thanks v much

Thank you for this question. I am very conscious of the temptation of generals to always be fighting the last war. In 2005 and 2006 there was some talk of a housing bubble in the USA but few people understood just how massive the liar loans problem was. Consumers had become extraordinarily overleveraged. As interest rates ground higher the first signs of trouble appeared in the underperformance of banks, rising credit card delinquencies and the collapse of leveraged hedge funds at major investment banks. The big question we need to ask is whether it will be these factors which are most relevant in this cycle?
Let’s think about the economy as made up of consumers, corporations and the government. After a decade of extraordinary monetary policy total debt has gone up but the US consumer has been de-levered while corporations and the government have seen their debt loads balloon.
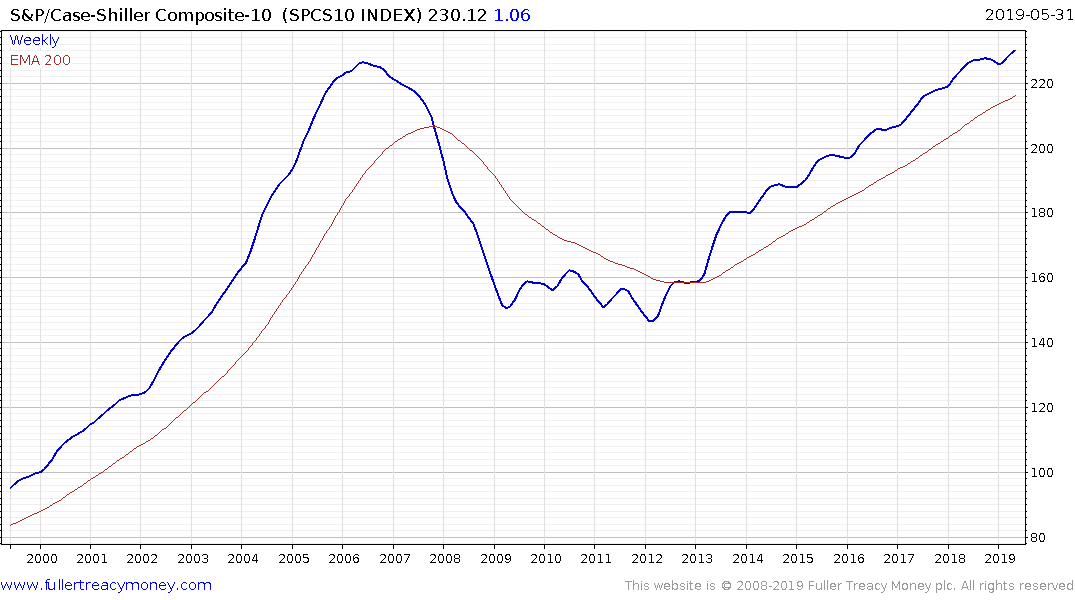
There is a temptation to look at the US housing market and think it is getting pricey so it must be a bubble. However new building has lagged significantly in this cycle, consumers are much less levered and lending standards have been much tighter. That doesn’t mean prices can’t come down but a crash is unlikely. Meanwhile it is probably more relevant to monitor property markets in London, Hong Kong, mainland China, Australia and Canada all of which are at extremely high levels relative to wages and have benefitted enormously from quantitative easing.
One of the reasons US consumers have not inflated a property bubble is because they just don’t have access to the funds necessary to do it and wages have been contained. Where there is evidence of egregious behaviour is in auto loans. With pick-up trucks now costing in the region of $70,000 there are a lot of people who have overstretched and that trend is rising. If we are looking for a rationale for lower interest rates this is it.
If the US consumer is not the epicentre of risk on this occasion, then what is? US municipalities, the US government, European governments, China’s municipalities and shadow banking sector, the property markets listed above and highly leveraged corporate balance sheets are all where the big risks reside today.
The collapse of funds like Neil Woodford’s in the UK, GAM in Switzerland and H2O in France give us a clue to where the problems are most likely to arise in this cycle. Private equity is the new shadow banking. The hunt for yield drove trillions into the private equity sector and that money has been put to use in myriad assets. Non-bank lenders write most US mortgages and the FHA underwrites them but for the most part they are not listed. That’s one of the reasons US banks have clean balance sheets but just looking at the banks is not enough when it is non-bank lenders where the risk is.
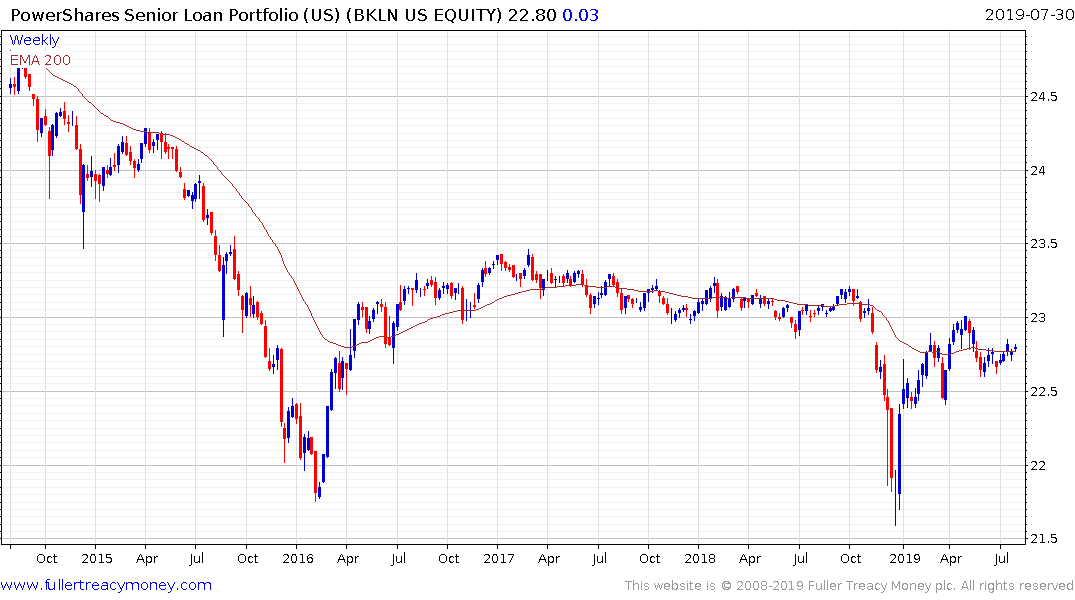
Leveraged loans are the asset class which has expanded most over the last decade. They are one of the primary sources of funding for the speculative ventures which have proliferated across just about all asset classes. JPMorgan has a wide number of Leveraged Loan Indices on Bloomberg but, unfortunately, I don’t have access to their feed. Senior Loan ETFs sold off very heavily in December and have recovered most of the decline. Nevertheless, this gives us a foretaste of what selling pressure is likely to look like in a real credit event for the sector.
Private equity has allowed so-called unicorns to prosper and stay private far longer than would be normal in any other cycle. The fact so many companies are now IPOing with little prospect of turning a profit is reminiscent of the “earnings don’t matter” mantra of the late 1990s.
The vast quantity of outstanding debt that is one notch above junk represents a threat to the wider debt markets. Some of the most highly leveraged issuers like Tesla, Netflix might have seen pressure on their equities but their bond risk is still reasonably well contained. Therefore, high yield spreads are probably going to be the most reliable indicator of stress in the corporate sector in this cycle.
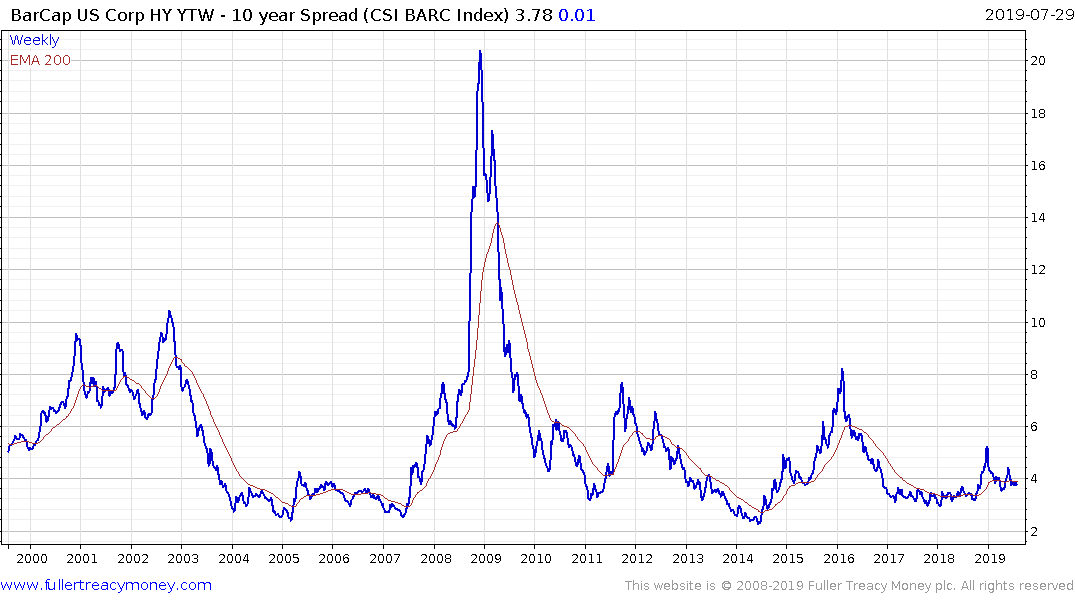
The spread popped on the upside at the end of last year and has contracted following the about turn performed by the Federal Reserve. However, this trend looks like a first step above the base. A sustained move above 500 basis points is when credit markets start to exhibit clear signs of stress.
.png)
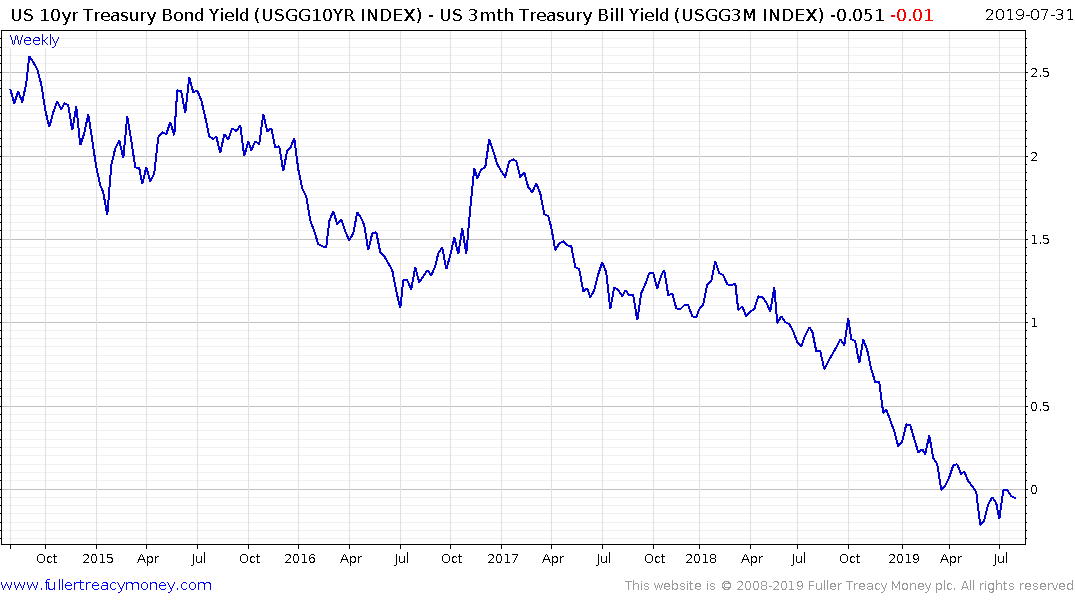
There has been a great deal of discussion about the yield curve spread over the last couple of quarters because of the belly in the yield curve. The 10-year - 3-month spread has been inverted for months but the 10-year - 2-yr is not yet inverted. The belly in the curve is pricing in more than a couple of rate cuts over the next 18 months. For that to coincide with a US recession, both spreads and the BBB spread would probably need to be inverted.
China also represents a significant risk in this cycle. Standards of governance have been deteriorating for years and the hubristic drive to achieve global dominance in economic, political and military arenas is backfiring. China has high leverage, a property bubble, liar loans, rising defaults, a slowing economy, an increasingly leveraged consumer, is losing friends internationally, rising domestic food inflation and slowing auto demand and slower commodity demand growth. Against that background we don’t have to look far for where the epicentre of risk is in this cycle. China is running a record budget deficit but absolutely needs to keep stimulating to avoid a recession. When we think about where the scope for policy mistakes to have dire consequences is most acute it is in China.
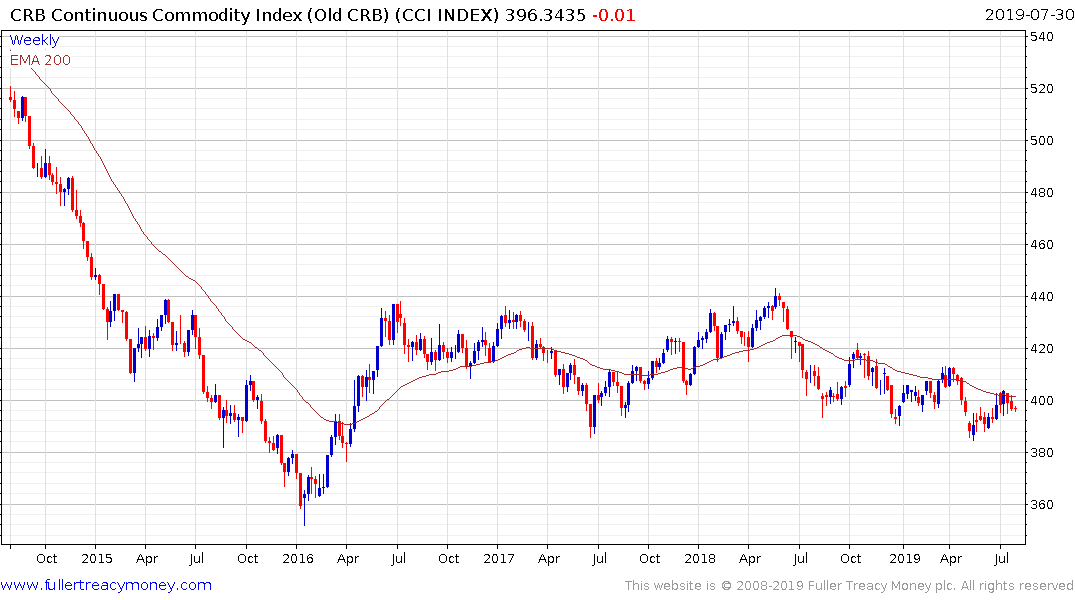
The continued downtrend in the Continuous Commodity Index suggest all is not well in China. Therefore, monitoring China’s willingness to continue to stimulate is one of the most important indicators to pay attention to because of the contagion risk it represents.
I think the most important thing to remember is these threats are well known and are the reason not one central bank, globally, is raising rates. Faced with the potential for bear markets in a significant number of asset classes, simultaneously, global monetary authorities have chosen to further inflate bubbles. The decision by the Fed to not only cut rates today but to end its quantitative tightening program early suggests they are aware of the risks and are willing to pre-empt clear evidence of a slowdown to forestall the worst effects. That is despite the insurance cut rhetoric in today’s post-meeting press conference.
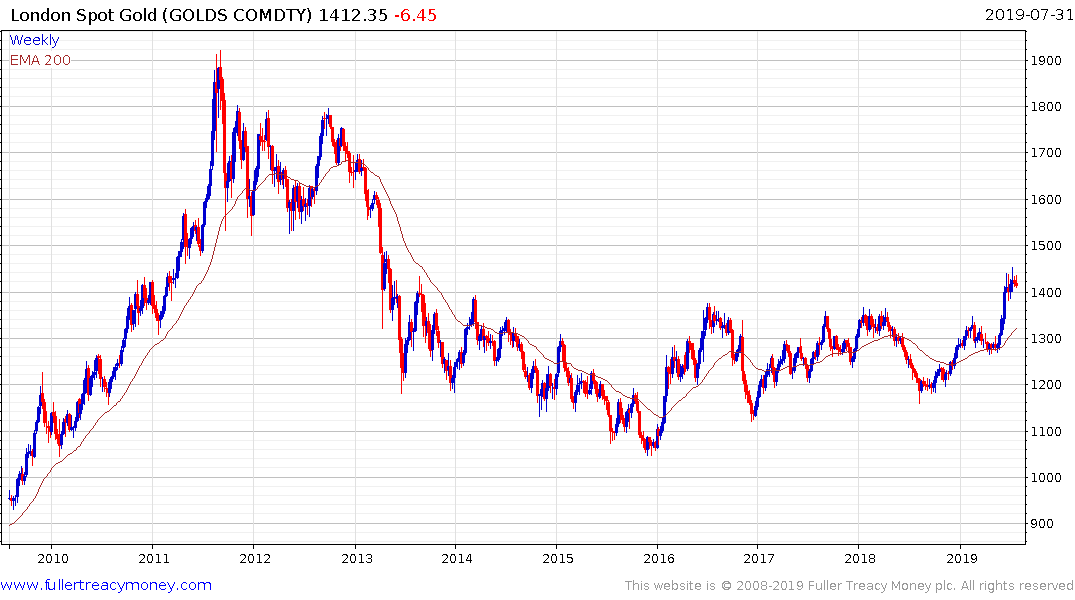
The willingness to continue to inflate asset bubble virtually ensures when the denouement eventually arrives it will be larger, deeper and more wide ranging than if these policies had not been followed. Renewed demand for gold is a clear signal investors are beginning to hedge their bets.
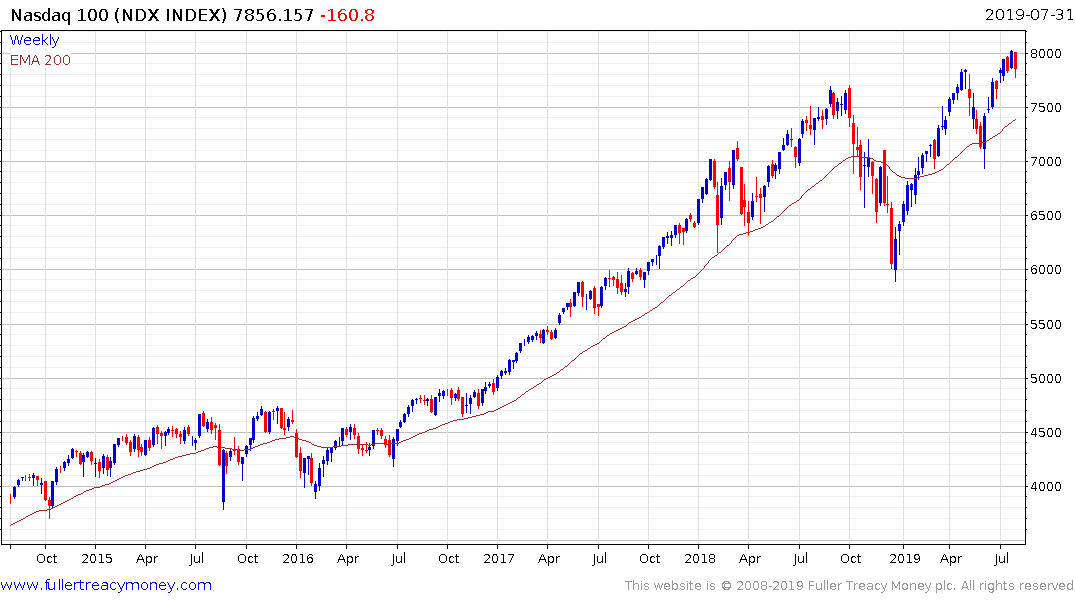
Perhaps the most important indicator of all to monitor is the stock market. The primary Wall Street indices are all at new highs. Provided these continue to hold above their respective 200-day MA moving averages we can given the benefit of the doubt to the bubble hypothesis.
The closes parallel I can think of for the situation evolving today is the mid to late 1990s. The Asian Financial Crisis, Long-Term Capital Management’s blow-up, the Russian debt default and Peso crisis all keep interest rates lower for longer and helped to further inflate a bubble in the technology, media and telecommunications sectors. Today the world is more interconnected so evolving debt problems in China, Turkey, Venezuela and South Africa have the potential to have deeper consequences on the stock market. However, the charts represent reality and they continue to point towards a sustained breakout.
Here is a link to Howard Marks’ latest memo. I agree with almost everything he has to say. The only place I differ is in I think the Fed is a serial bubble blower and it is not yet ready to tackle this one. If Powell truly believes we are mid-cycle that suggests ample liquidity for the foreseeable future.
Back to top