
Divergence between historic P/Es and Estimated P/Es

Following what was an important week for earnings last week and with both Apple and BMW reporting this week I thought it might be instructive to compile a list of companies where there is a wide divergence between the historic P/E and the estimated P/E. When the historic P/E is very high, or non-existent because earnings were negative in the last quarter, but has contracted significantly on the estimated P/E for next year it is generally an indication of improving perceptions of future potential.
Here is a link to the associated Excel sheet.
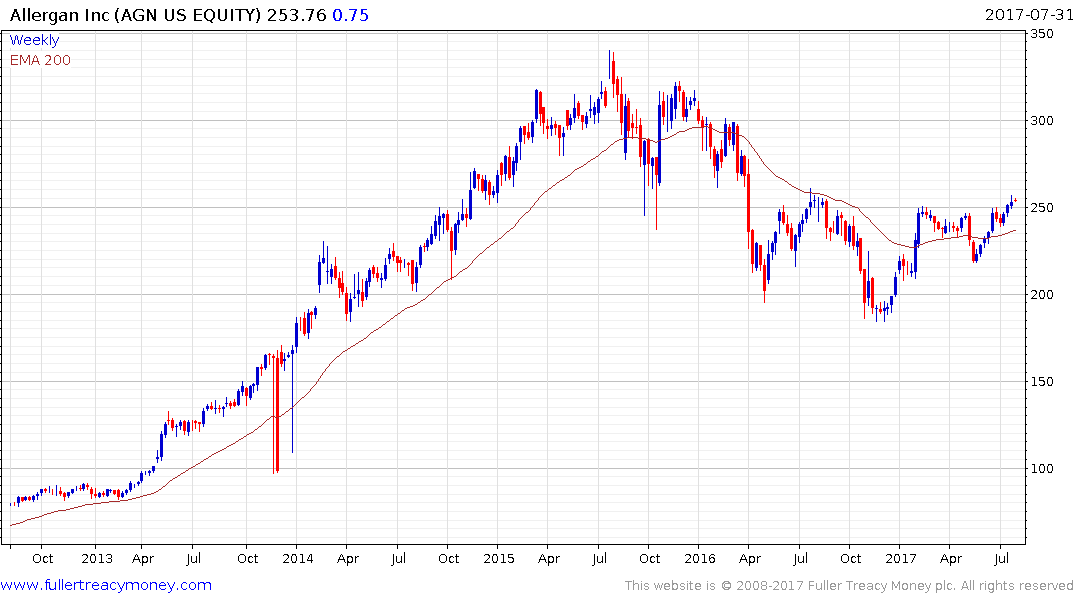
For example, Allergan has an historic P/E of 4217 and an estimated P/E of 15.19. That reflects the difficult trading environment the company experienced following the failed merger with Pfizer, the maturing market for Botox and the cost of a lawsuits. However, the share has been improving of late, in line with the Biotech sector, and it moved to a new recovery high last week. A sustained move below the trend mean would be required to question medium-term scope for additional upside.
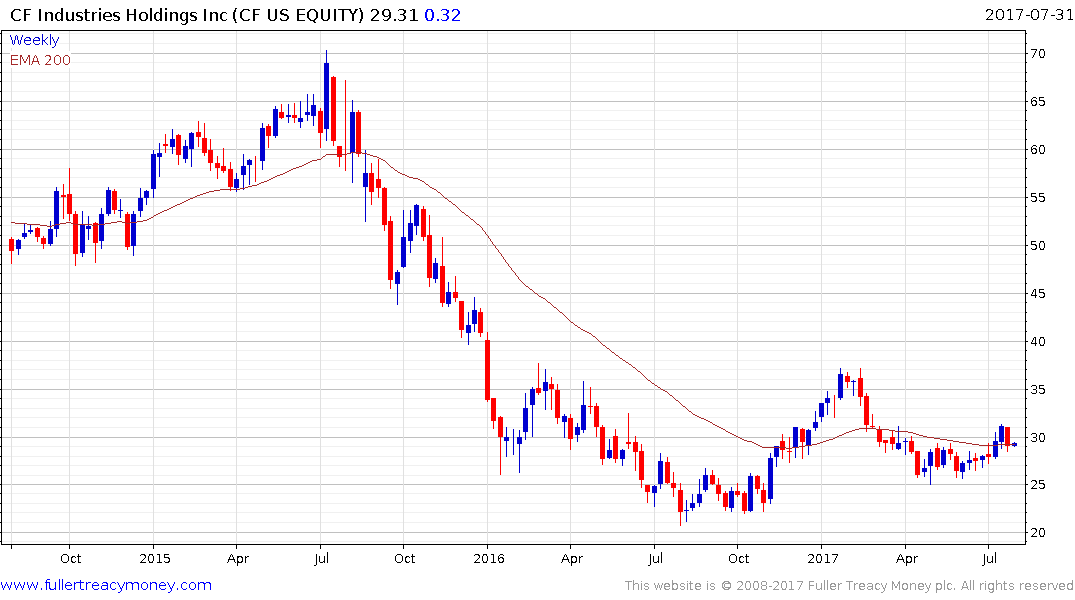
CF Industries is at the opposite end of the spectrum. It has an historic P/E of 3441 but is expected to report negative earnings in the next quarter so it does not have an estimated P/E. The share has been ranging between about $20 and $40 following the collapse in 2015 and pulled back sharply last week.
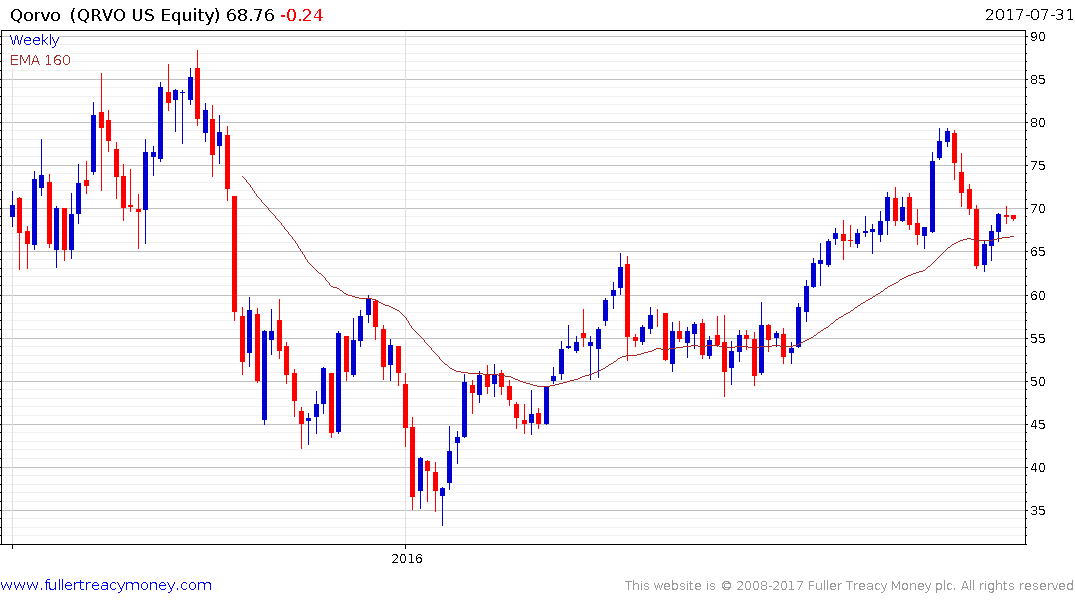
In the semiconductor sector, Qorvo has an historic P/E of 509 and an estimated P/E of 10.7. The share bounced over the last few weeks from the upper side of an underlying range.
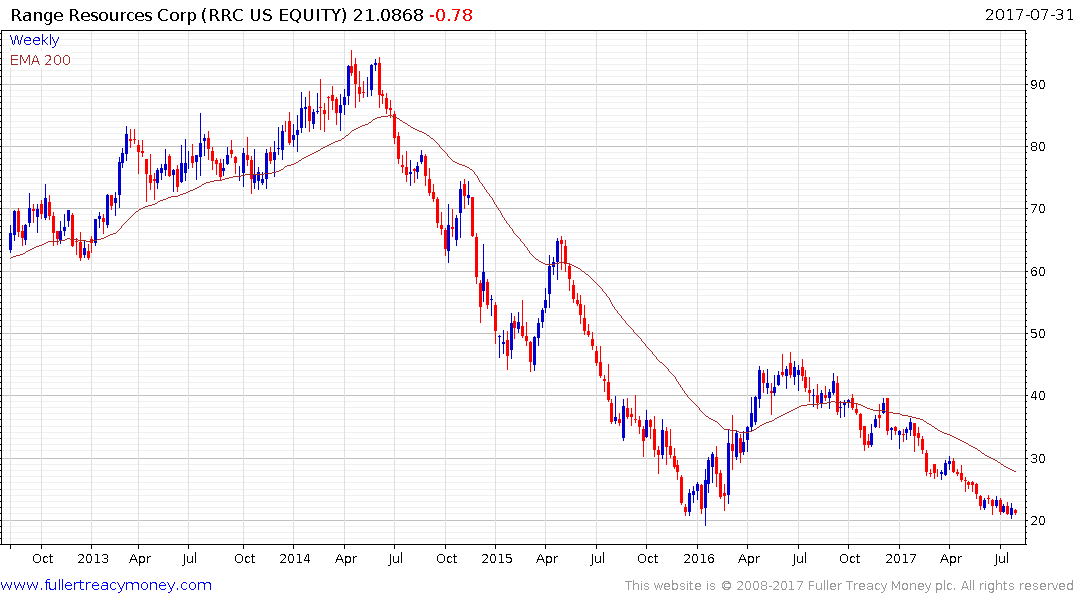
Range Resources has an historic P/E of 357 and an estimated P/E of 24. The share has not been immune to the weak oil price environment but is now back testing the region of the early 2016 lows. A sustained break in the progression of lower rally highs would confirm more than short-term support in this area.
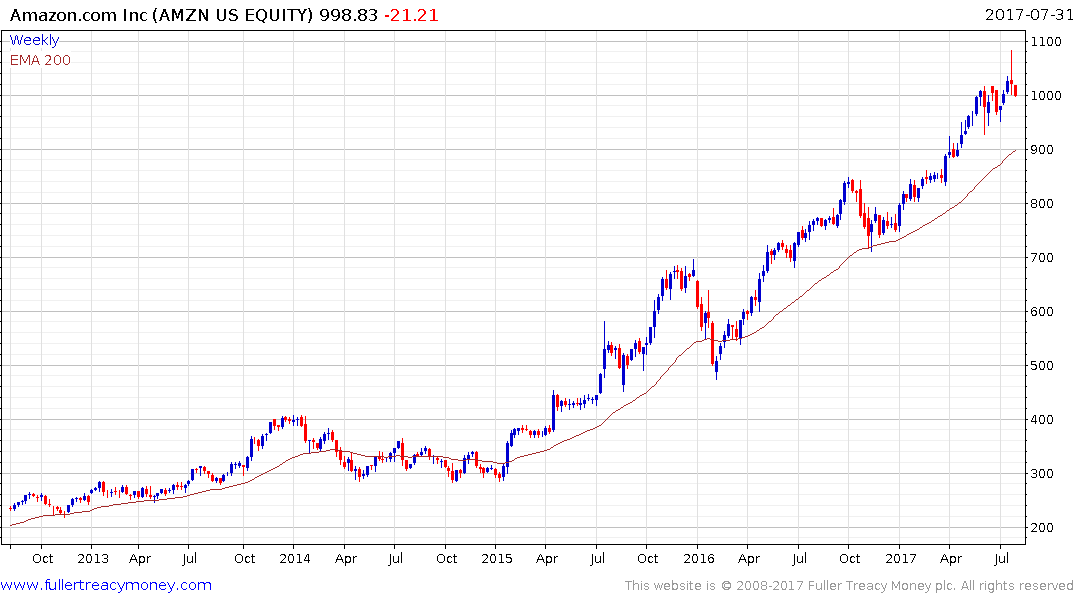
Amazon and Netflix are among two of the highest profile shares in the world. Amazon has an historic P/E of 258 and an estimated P/E for next year of 64. The company’s growth has ensured that divergence between current and future expectations for growth have been a feature of the fundamental landscape for most of the last decade. The share is currently susceptible a further reversion towards the mean following last week’s blow-off.
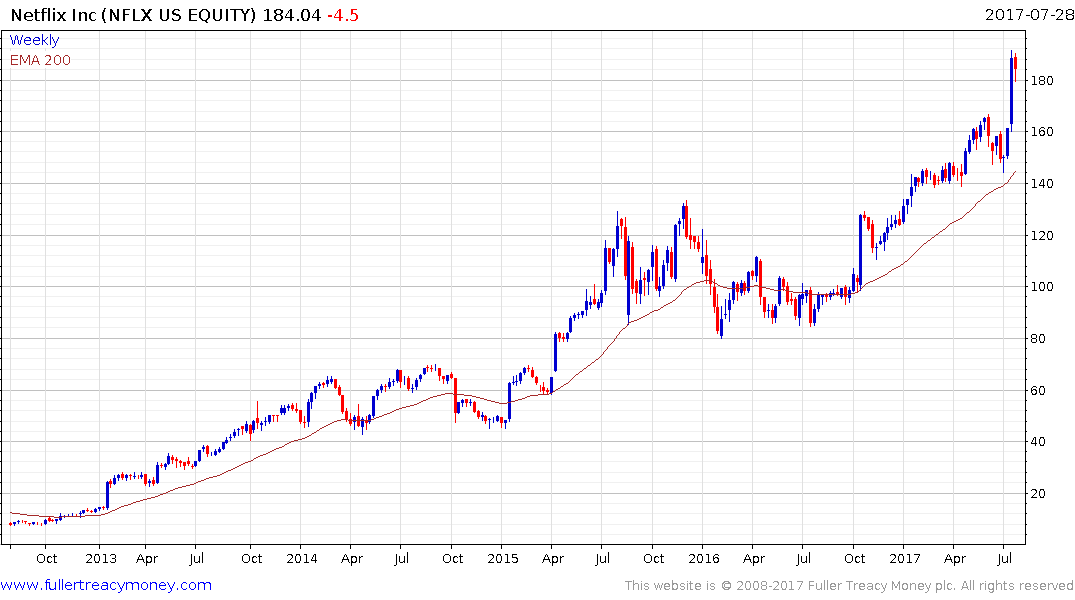
Netflix has a similar expected growth trajectory with an historic P/E of 224 and an estimated P/E of 78. The share surged higher on the 18th and some consolidation is now underway.