
Consistency Characteristics

“A consistent trend is a trend in motion” is one of the most important adages from The Chart Seminar. David’s words “If a trend has further to go now, it will sustain the upward break” are ringing in my ears as the primary Wall Street indices and an increasingly number of European indices break out.
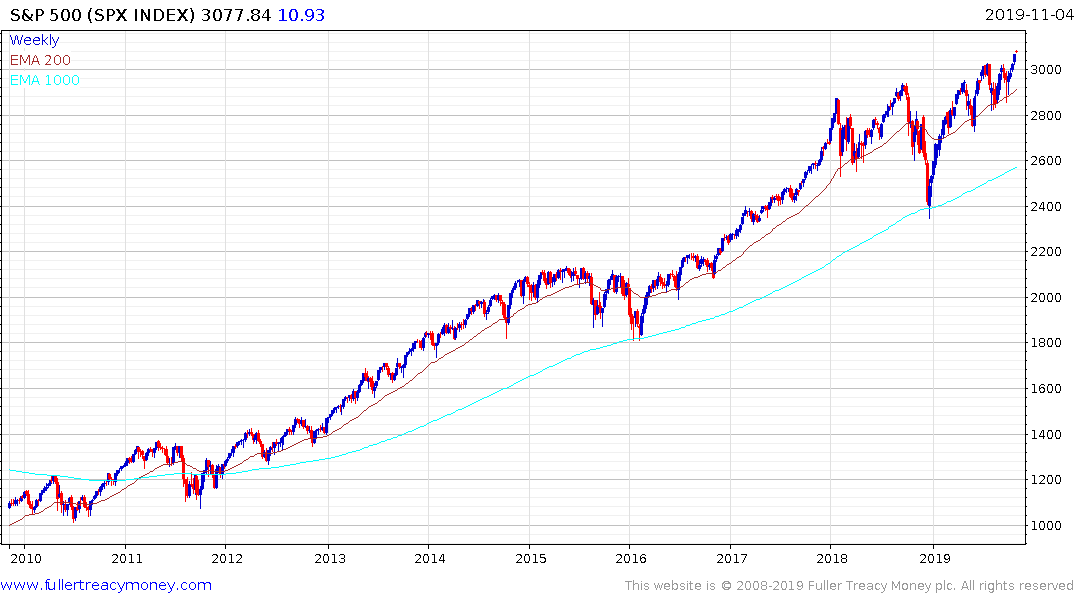
The S&P500 has some of the most clearly identifiable consistency characteristics. There have been three 18-month medium-term corrections over the course of the last decade. Each of these congestion areas represented trend inconsistencies relative to the previous consistent trending period. However, when we look at the trend over the last decade we are presented with 18-month trends punctuated by 18-month ranges. During the trending phases the 200-day MA has been an area of support but during the volatile ranging phases the 1000-day MA has been an area of support. Every time there has been a transition from a ranging phase to a trending phase there has been a multi-month consolidation in the region of the peak but after that the breakout has been sustained. If this pattern is going to be repeated then the breakout will hold and we can expect another persistent trend to evolve over the coming 18 months.
A failed breakout at this stage, with a sustained move below the 200-day MA, would represent a major trend inconsistency for the decade-long trend, because every breakout, from a lengthy range, has been sustained over the course of the decade-long bull market. A failed break would signal a significant change to the relationship between supply and demand which created the trend in the first place and would be a warning sign for top formation development. Right now, there is no evidence of a failed break so we can give the benefit of the doubt to the upside.
Back to top