Bridgewater Bets Big on Market Drop
This article by Juliet Chung and Gunjan Banerji for the Wall Street Journal may be of interest to subscribers. Here is a section:
Bridgewater paid roughly $1.5 billion for the options contracts, or just about 1% of the Westport, Conn., firm’s $150 billion in assets under management, according to people familiar with the matter.
The options contracts are tied to around $100 billion worth of the indexes, said people familiar with the matter. How much the firm stands to potentially make would depend on many factors, including the magnitude of any market decline and the timing of when the firm cashes in its bet.
It couldn’t be determined why Bridgewater made the investment. Several clients said it may simply be a hedge for significant exposure to equity markets the firm has built up. Funds often hedge, or take offsetting positions, against other exposure to protect against losses.
The massive size of the wager has prompted chatter among traders and caused the price of some options to rise.
There has been a surge in put options outstanding tied to the S&P 500 index. The number of S&P 500 put options outstanding hit the highest level in more than four years in September, according to data provider Trade Alert. There has also been growing interest in S&P 500 put options expiring in March, the data show.
Ray Dalio stated today Bridgewater is not net short of the stock market. The firm’s investment strategy has long been characterised by risk parity which is aimed at capitalising on the continued correlation between stocks and bonds. The size of positions using such a strategy is tailored using volatility metrics. As volatility in one increases the weighting of that asset necessary falls and the weighting of a counterbalance increases and vice versa.

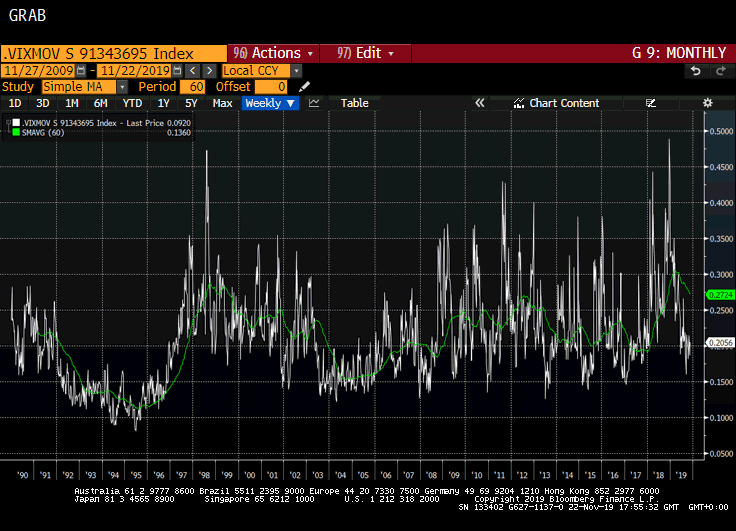
At the end of 2018 equity volatility relative to Treasuries volatility spiked to a new high. Just like peaks in the VIX Index are generally a better indicator of market bottoms, than troughs are of peaks, the ratio suggested the beginning of this year was a favourable time to have long positions relative to bonds. That is true even though bond yields also compressed significantly from the 2nd quarter.
The ratio is now back at the lower side of the range which has persisted since 2003. If I had to guess Bridgewater has taken out a hedge to protect themselves from an unexpected pop on the upside for this ratio which could see stocks underperform bonds.

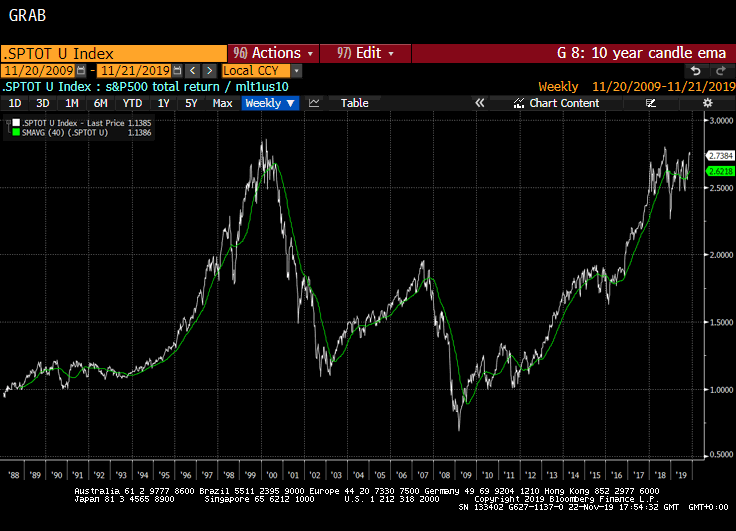
The total return for the S&P500 Total Return / Merrill Lynch 10yr+ Futures Total Return Index has been ranging in the region of the 2000 peak since early 2018. The long-term chart highlights just how much stocks underperformed bonds on a total return basis between 2000 and 2009. The era of QE and asset price inflation changed that trend. A break on the upside for this ratio would be further confirmation of a change to the secular trend to outperformance by stocks.


