
Beware Misreading Inverting Yield Curve
This article by Mohamed A. El-Erian for Bloomberg may be of interest to subscribers. Here is a section:
“The extraordinary abrupt end to central bank hiking cycle + Fed paranoia of credit event is uber-bullish credit & uber-bearish volatility,” strategists including Michael Hartnett wrote.
While negative yields on paper suggest that investors lose money just by holding the obligations, bond buyers could also be looking at price gains if growth stalls and inflation stays low. But along the way, risk assets may be entering the danger zone.
“We’ve never seen monetary easing so long, so broad, so big,” said Brian Singer, head of dynamic allocation strategies at William Blair, a Chicago-based fund manager that oversees $70 billion overall. “What’s happened after every significant period of accommodation is a reckoning. This time the bubble is lower-rated credit and illiquid private assets.”

There is always an argument about the efficacy of an inverted yield curve as a lead indicator. It was exactly the same back in 2005 when the yield curve first became inverted. There were calls that this occasion is different because of the bull market in commodities, the rise of China and the strength of the housing market all of which proved to be fallacious.
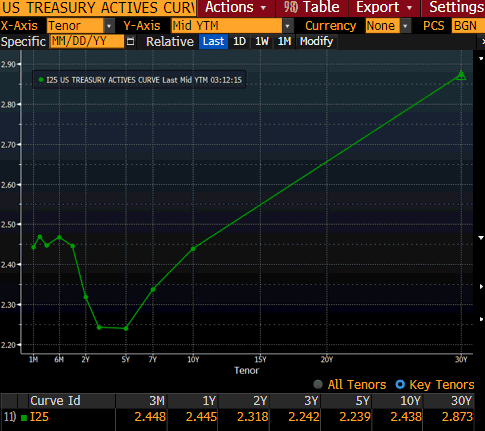
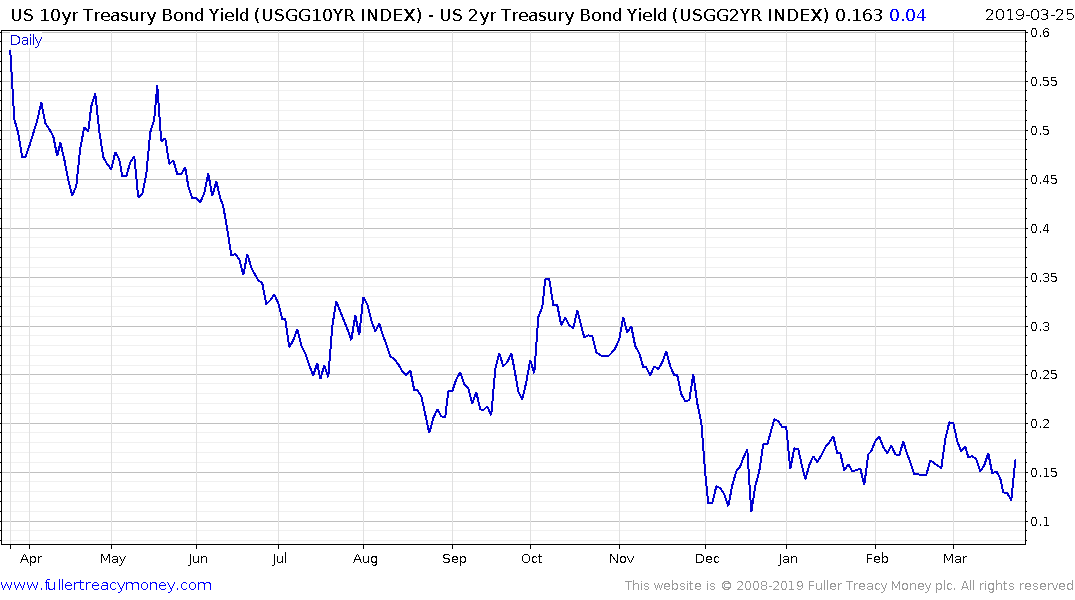
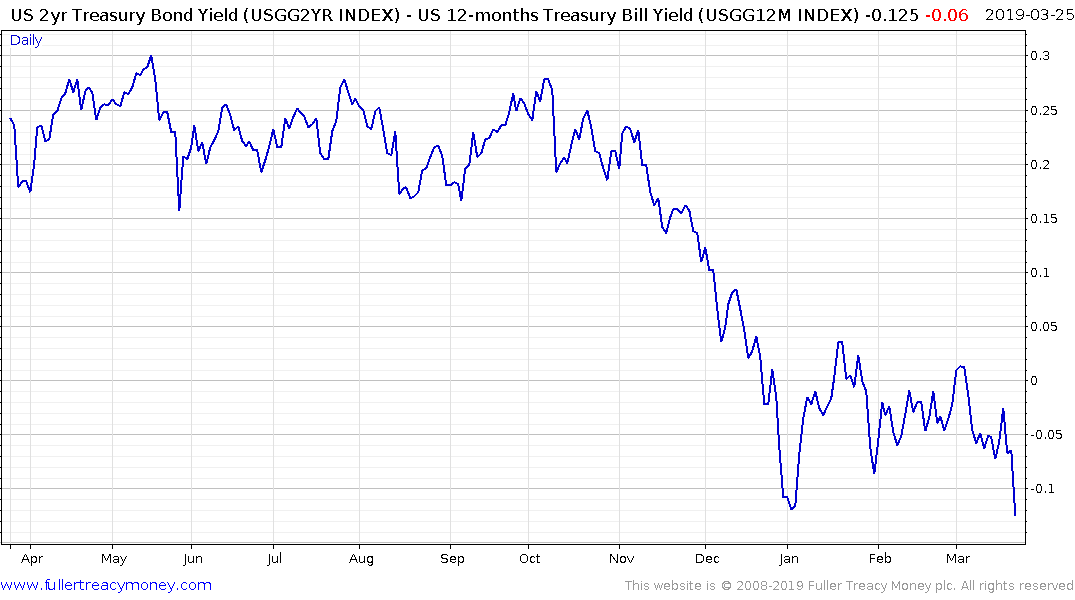
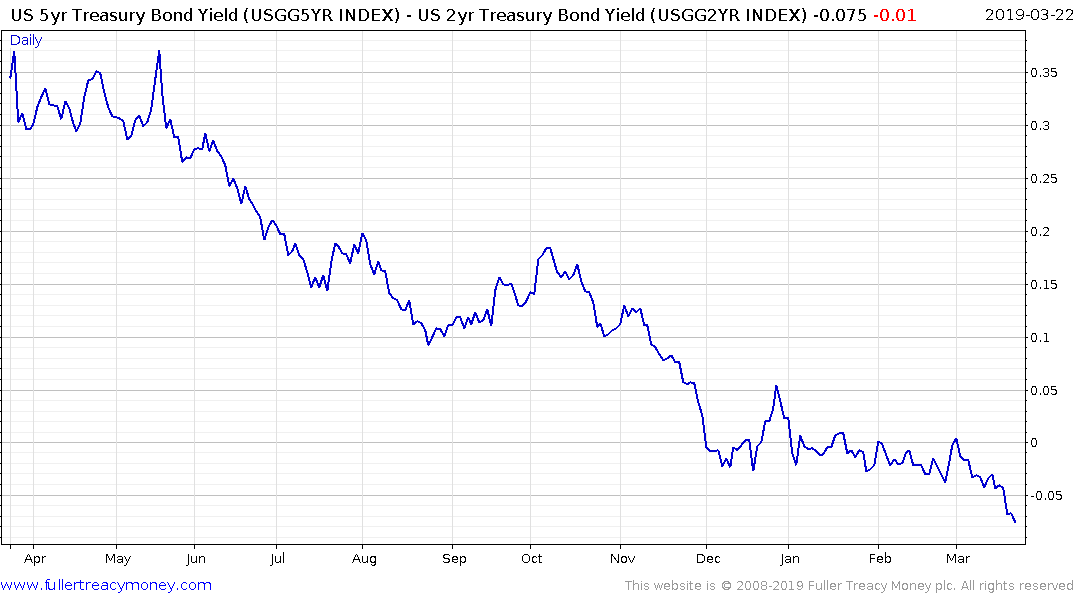
There is a significant belly in the yield curve right now with maturities out to 12 months yielding more than everything between 2 years and 10 years. However, the most common measure of the yield curve spread, the difference between the 2 and 10 year, has not, yet, inverted.
.png)
Nevertheless, the flatness of the curve, the inversions at different parts of the curve and significant rally in bonds all point toward the conclusion we are at the top of the interest rate cycle. The suggests the only way is down for interest rates. The logical conclusion is the only way the Fed will cut rates is if the economy slows significantly from where it is right now, so that is the clearest reason for stress.
The flatness of the curve is particularly bad for banks as they see their margins compress. There is no argument about that which is why they have been selling off so aggressively over the last few days.
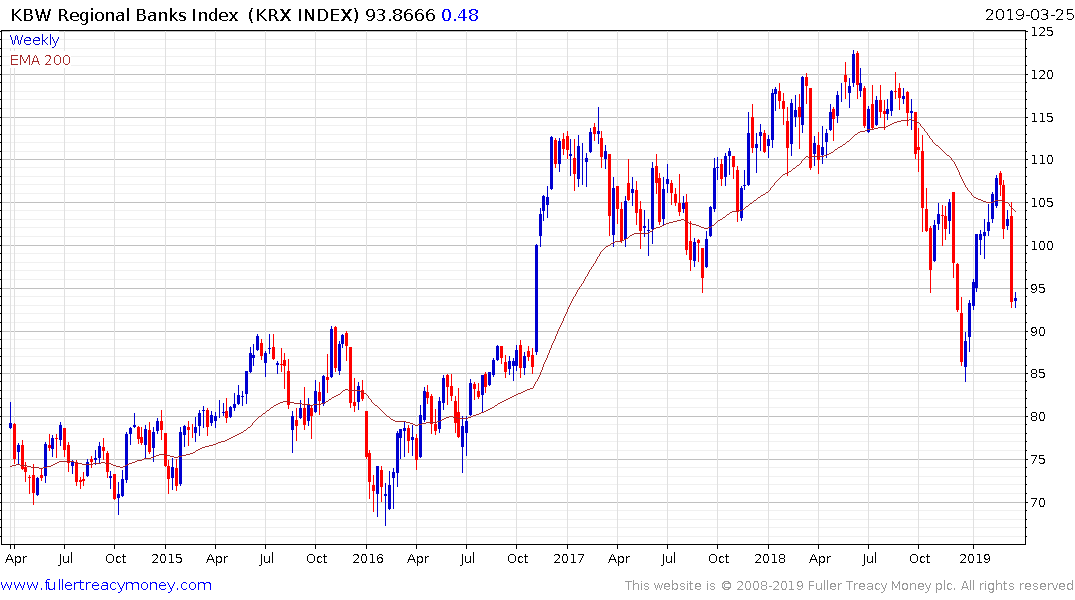
The KBW Regional Banks Index has Type-2 top, with righthand extension, characteristics as it pulls back from the region of the trend mean.
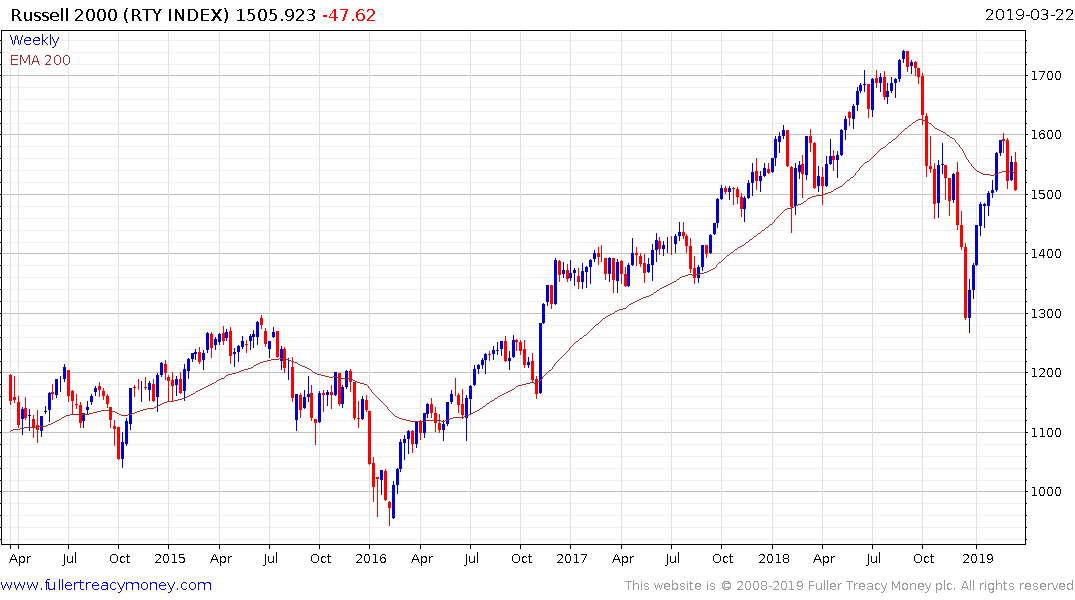
Meanwhile the underperformance of the Russell 2000 is also noteworthy. Small caps are sensitive to credit availability so if banks pull back from lending that inhibits the ability of small caps to finance expansion.
The much broader picture is the yield curve is a lead indicator, not a coincident indicator. It is quite normal for the market to continue rallying for anything from six to eighteen months after an inversion.
I think it is important to highlight that we are in the first half of the third year of the US Presidential Cycle, where we often get a significant buying opportunity which is preceded by a growth scare that prompts easier monetary policy. So far, that script is playing out, suggesting near-term risk of weakness, followed by better performance in the latter part of the year. With such a polarity of outcomes there hasn't as important a time to monitor the market in the last decade.
One piece of good news is the failure of the Mueller report to find collusion between the Trump campaign and Russia reduces potential for a left wing progressive electoral upset in 2020.
Back to top