
Banks Rush to Backstop Liquidity With $165 Billion From Fed
This article from Bloomberg may be of interest. Here is a section:
Analysts at JPMorgan Chase & Co. estimated $2 trillion as an upper level for how much liquidity the new backstop could ultimately provide, although they also developed a smaller calculation of around $460 billion based on the amount of uninsured deposits at six US banks that have the highest ratio of uninsured deposits over total deposits.

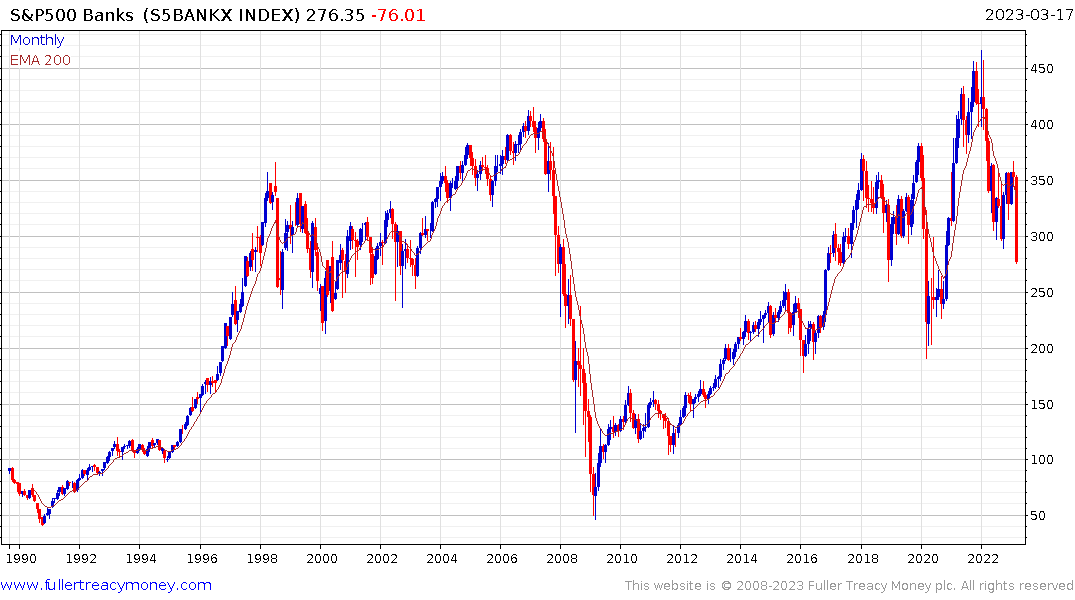
I think everyone has been perplexed by the relative strength of the Nasdaq-100 over the last week. The market-to-market losses on bank balance sheets are unresolved, even with the backstop for depositors. At a minimum that means less credit will be available over the next year. That increases the likelihood of a recession.
Yesterday, I wrote about the investment flowing into semiconductor manufacturing capacity as a precautionary measure to insure against the risk of Taiwan’s export capacity being unavailable. That does not explain bitcoin’s relative strength.
I have regarded bitcoin as a key liquidity barometer for the last several years. It has now cleared the psychological $25,000 level and we are about a year out from the next halvening. Those events occur with a cyclicality that has tended to coincide with central bank largesse.
 The Fed’s balance sheet has jumped by $300 billion in the last week. That unwinds a bit less than half of the quantitative tightening program. The biggest lesson of the last 15 years has been liquidity infusions inflate asset prices and support bond values. That’s why I created the total central bank asset chart in 2012.
Every time reducing the size of the balance sheet has been abandoned, they have had to almost double its size to offset the deflationary/contraction it kicks off. The total assets chart bottomed in September and continues to recover. Since central banks are still raising rates, it is not accelerating higher just yet but this looks like support building.
As I discussed in yesterday’s video, I am less convinced by this argument this time around. For one thing I created that chart a decade ago. This is a well understood trend today which suggests it should have less predictive power.
Inflation needs to come down more, and stay down, to deliver the ideal conditions for liquidity to fuel asset price appreciation. Governments have chronic funding needs and populations in no mood to pay higher taxes or accept reduced benefits. That suggests the trend will continue to be inflationary.
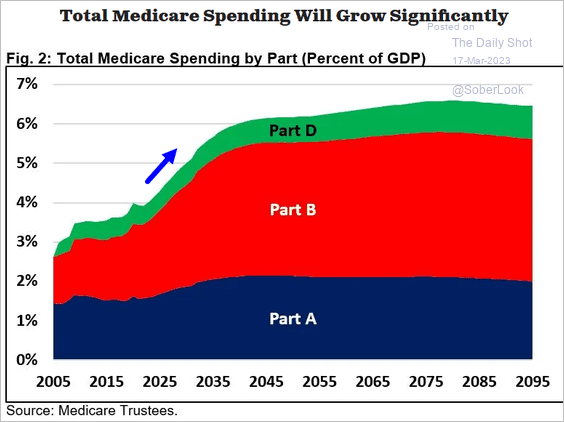
The outlays for Medicare in the USA are due to jump from 3% to 5% over the next couple of years and the Social Security Fund will certainly have taken a hit from the dual bear markets in bonds and equities. The fund’s reports on its projected exhaustion date are due in June. https://www.ssa.gov/policy/trust-funds-summary.html
I’ve been clear in my belief that balance sheet contract contributes to deflationary fears. That also means if the Fed’s balance sheet contraction is over, the outlook is likely to be more inflationary.
The market could easily deliver deflationary fears first, fuelled by the continued weakness in the banks sector. That would elicit a more powerful central bank response and inflation would put in a higher reaction low.
This email from a subscriber may also be of interest.
"Listening to the final part of today's audio reminded me of what we lived through in the 1970s, namely stagflation. The younger generation has no experience of high-level inflation, and it is assumed that once the interest rate rises are sufficient to bring inflation down the economy will start recovering. I can remember the very long period of time when inflation remained high and in the West, we were getting 15% interest income. At that time inflation, and stagnation of the economy coincided. Best wishes A"
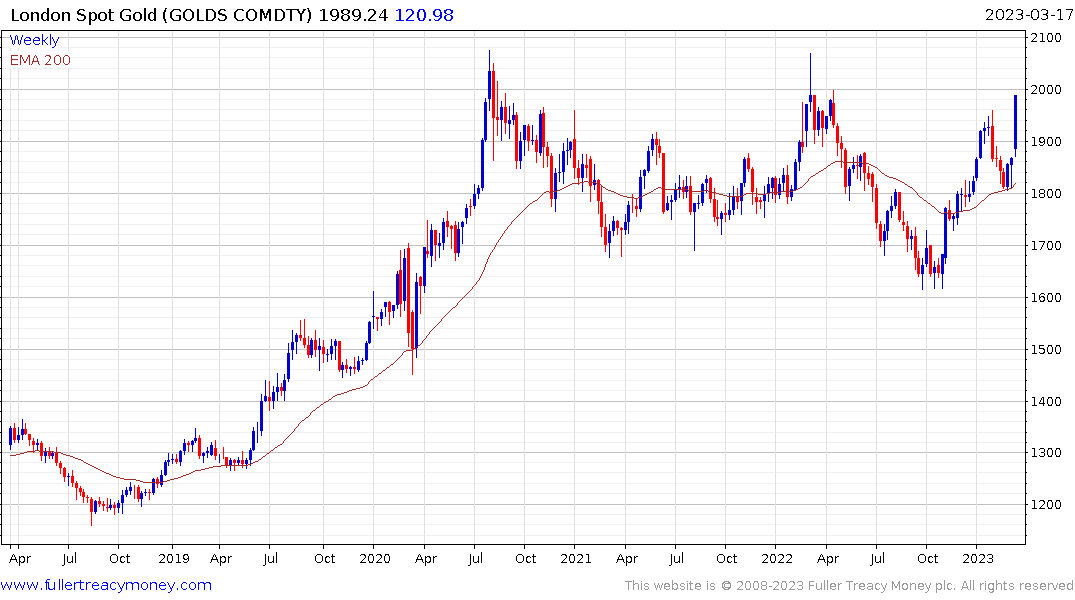
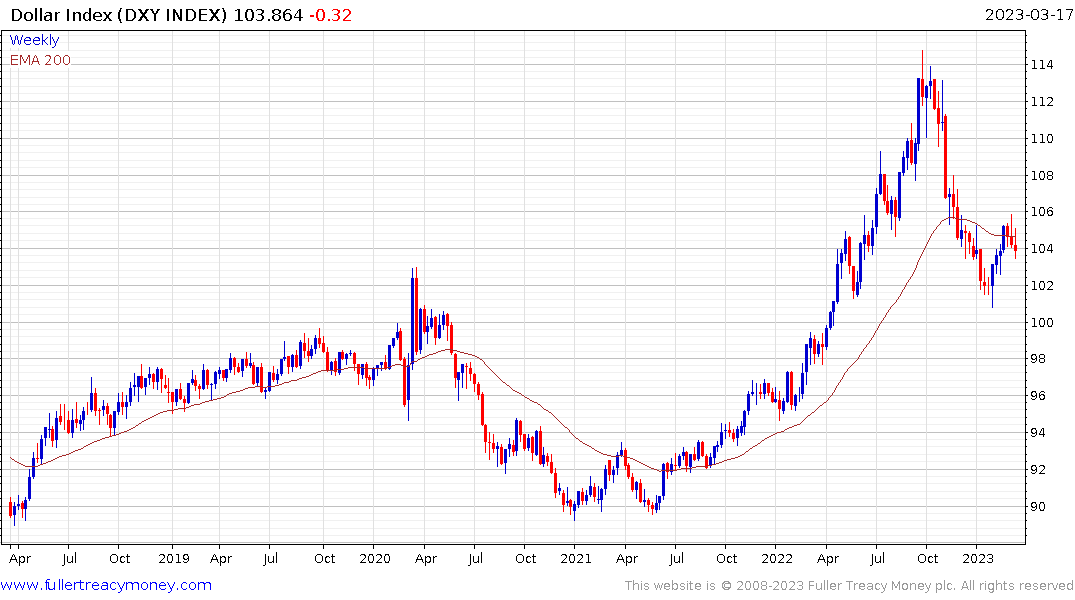
Gold rebounded emphatically this week to retest the $2000 area and the Dollar Index is rolling over from the region of the 200-day MA.
That clearly signals investors are positioning for money printing on a grand scale.
Back to top